This page contains information relevant to the CDS calibration.
In particular, for the SOHO INTERCALIBRATION WORKSHOPS.
Some of the figures shown here are taken from
Del Zanna et al., (2001):
Solar EUV spectroscopic observations with SOHO/CDS
I. An in-flight calibration study
where many details can be found. This paper has been accepted for
publication in A&A.
Here is a g-zipped postscript version
Please note that some of the figures are in colour.
Additional details can also be found in Del Zanna (1999, PhD Thesis).
Some of the figures shown here are unpublished.
This page was created by
Giulio Del Zanna
and last modified on Sept 26 2001.
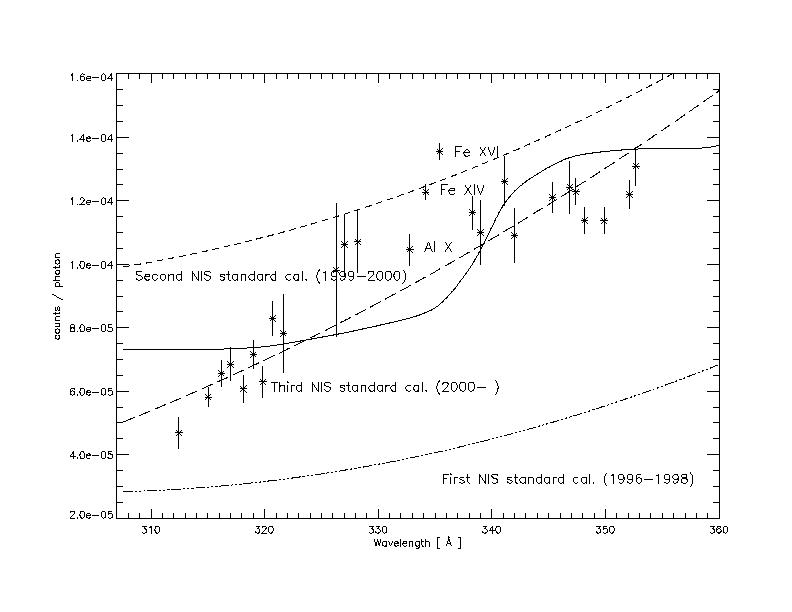
The proposed CDS NIS 1 sensitivity (solid line),
compared with the other calibrations. The asterisks indicate the
scaled values of the sensitivities, as derived from ratios of lines
of the same ion observed within this detector.
Excellent agreement is found between the calibration
presented here and the other two independent in-flight studies based on rocket
flights in 1997.
In particular, the values of the calibration presented here
almost coincide at 368 \AA\ with the
only reliable absolute NIS 1 measurement of Brekke et al. (2000).
Significant discrepancies with the ground measurements are found.
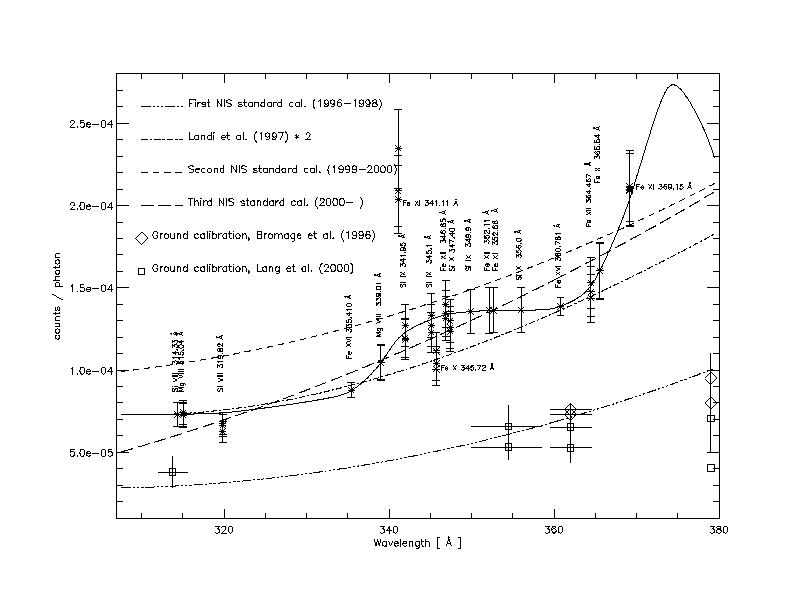
The proposed NIS 1 sensitivity (solid line), compared
with the absolute values derived from the CDS / SERTS-97
cross-calibration (stars), and the previous NIS 1 standard calibrations.
Very good agreement with the calibration proposed here is
found, in particular at 320 \AA\ and in the region
339-353 \AA.
The main disagreement concerns the lines that have been
labelled, AL X 332.8 \AA, Fe XIV 334.2 \AA, and Fe XVI 335.4 \AA.
The CDS and SERTS-97 observed a very bright active region,
and these lines were the most prominent ones in the SERTS-97
spectrum (indeed the measurement error is very small).
The observations were made at a location with steep spatial gradients in the
hottest lines, and any small spatial misalignment between the two
instruments would mostly affect these three lines, that are the
higher temperature lines in the SERTS-97 spectrum
(R.J. Thomas, 2001, priv. comm. - further work is in progress).
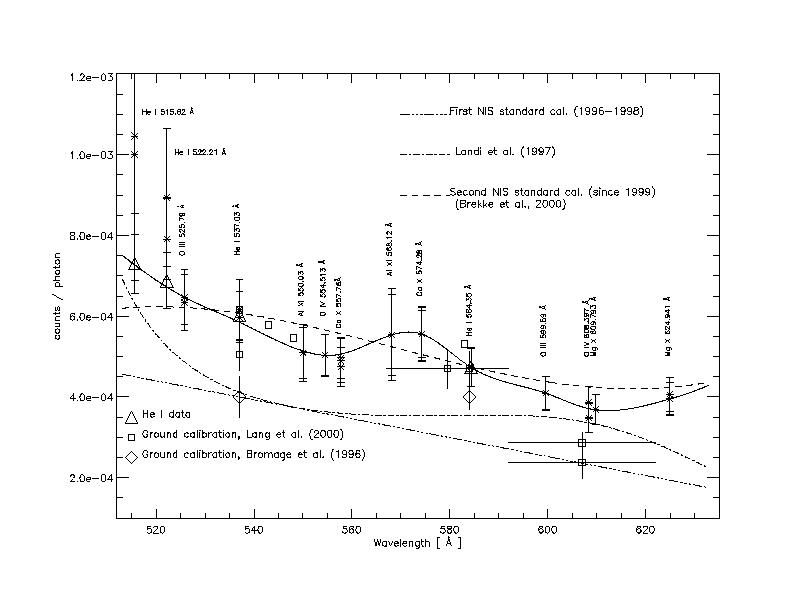
The proposed CDS NIS 2 sensitivity (solid line),
compared with the other calibrations.
The only direct in-flight absolute calibration study is that of
Brekke et al. (2000).
In considering a detailed comparison with the diagnostic study
presented here, it should be noted that
the coarse resolution ($\simeq$ 5 \AA) of the
rocket flight spectrum limited the evaluation of the instrumental background,
increasing the uncertainty.
The spectra have been binned into six wavelength regions, and the background
estimation was very difficult.
The downturn at wavelengths below 530 \AA\ is regarded as uncertain
by Brekke et al. (2000), because of low signal.
The region 590-610 \AA\ proved difficult to fit and was
not used by Brekke et al. (2000).
Considering the above, these results and Brekke et al. (2000)
ones are very much consistent.
Note that neither the ground calibration measurements nor
the theoretical predictions of the sensitivities
are in accordance with both the direct in-flight results of
Brekke et al. (2000) and those presented here.
In particular, there is no agreement with the He I lines.
Finally, it is interesting to note that the calibration proposed
here would partly explain the discrepancies that were found
when the SUMER detector A and the NIS calibrations were compared in-flight at
584, 610, 625 \AA (see Pauluhn et al., 1999).
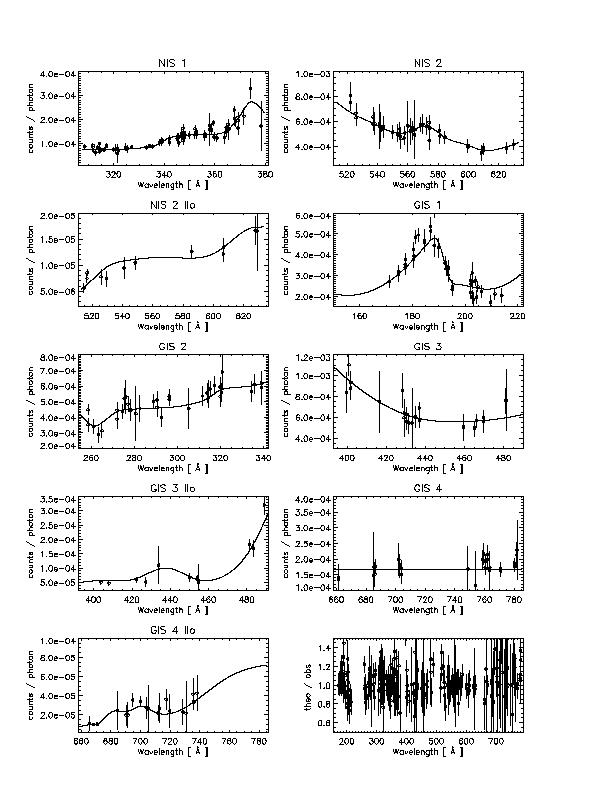
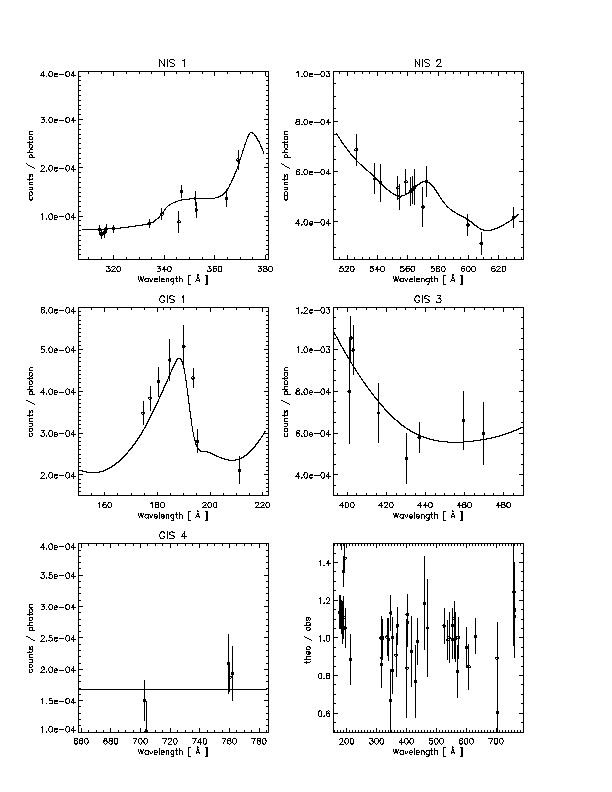
The CDS NIS and GIS sensitivities (solid lines),
first and second order, as derived from pre-recovery
observations. The absolute sensitivities derived from
all the line ratios used are superimposed.
The bottom right plot shows the ratio of the theoretical vs. the
observed line intensities for all the line used.
The post-recovery sensitivity values derived from the
observations of May 1999.
The bottom right plot shows the ratio of the theoretical vs. the
observed line intensities. No significant changes in the
calibration are present.
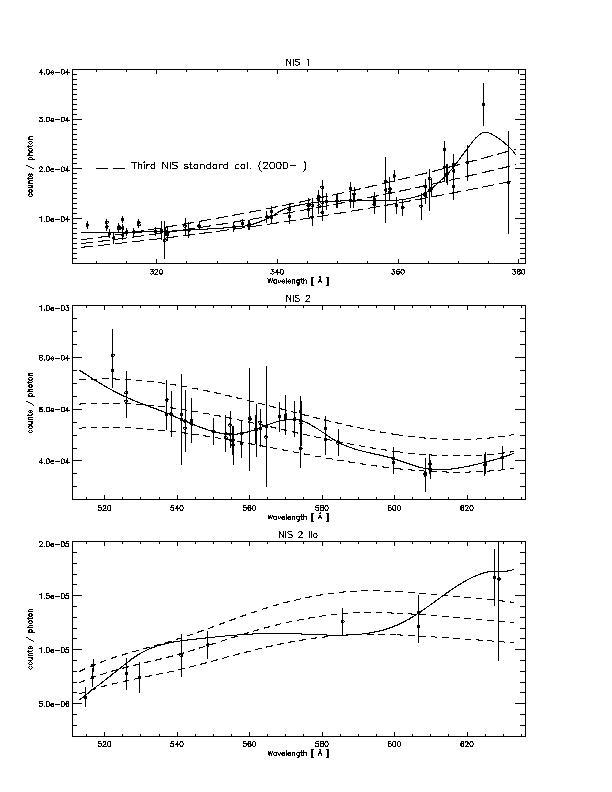
The CDS NIS sensitivities (solid lines),
first and second order, together with the current
curves now (2001) present in the standard software (dashed lines,
with +/- 15% lines).
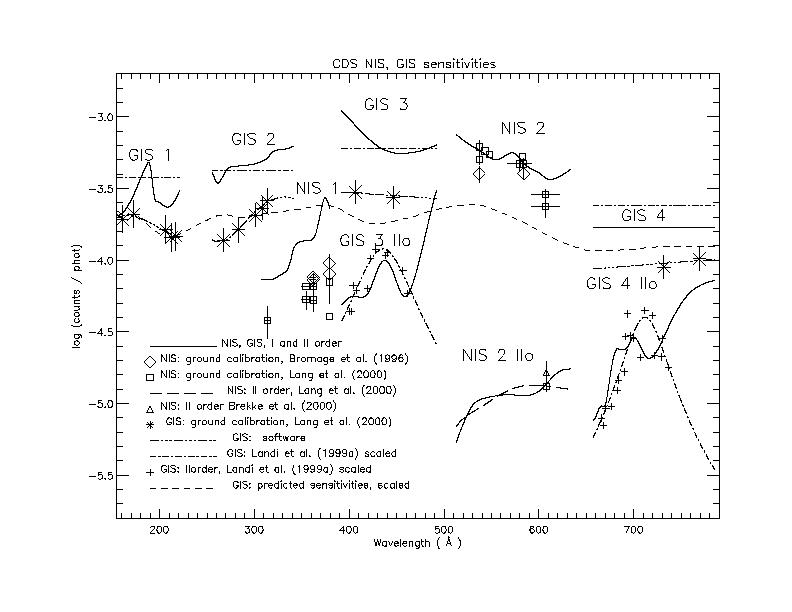
The CDS NIS and GIS first and second order sensitivities
proposed here (solid lines).
All the pre-launch NIS and GIS measurements are also displayed.
The overall GIS predicted efficiency, as a function of wavelength,
is plotted with a dashed line (arbitrary scale).
For the NIS 2 second order, the value found by Brekke et al. (2000)
is also shown.
For the GIS, the sensitivities derived by Landi et al., (1999a)
for the first and second orders are also displayed (absolute
values scaled by a factor of 2).
For the GIS 3 and 4 second orders, the points used by
Landi et al. (1999a) to derive the curves are also displayed (crosses),
to show that those data are broadly
consistent with the curves presented here.
The main features of the calibration presented here,
compared to the previous studies are listed below.
Note that
the cross-calibration was obtained by fixing only one point,
at the He I 584 584 \AA, with an
absolute value chosen to be in agreement with the
Lang et al., (2000) value.
-
Much increased sensitivities in NIS 1 and in all the GIS channels,
compared to the pre-launch values.
For the NIS 1 case, the factor is about 2 (1.9 at 317 \AA\ and 2.2 at 362 \AA),
while for the GIS case the factors are more variable
(1.45 at 206 \AA, GIS 1; 2.8 at 283 \AA, GIS 2;
2.9 at 406 \AA, GIS 3; 1.9 at 732 \AA, GIS 4).
-
Good agreement for NIS 1 with other
in-flight studies.
-
For GIS, it is interesting to note that the calibration proposed
here would explain the discrepancies that were found
when the SUMER and the GIS calibrations were compared in-flight at
770 \AA, and where a factor of 2 was also found (Pauluhn, 2001, priv. comm.).
-
Excellent agreement (within few percent) of the second order NIS 2 sensitivity at
608 \AA\ (He II 304 \AA\ line, 1.36 $\times$ 10$^{-5}$)
compared to the only pre-launch
measurement by Lang et al. (2000; 1.32 $\pm 0.11 \times$ 10$^{-5}$).
The measurement of Brekke et al. (2000) is about 20\% higher
(1.64 $\pm 0.12 \times$ 10$^{-5}$), while
the SERTS-97 flight has provided a value of
1.68 $\pm 0.25 \times$ 10$^{-5}$ (R. Thomas, priv. comm.).
Some differences with the predicted second order sensitivities
at the other wavelengths are found.
-
The wavelength variations of the sensitivities, within each GIS channel,
can be regarded as consistent with the few pre-launch GIS measurements,
except for GIS 2 where a steeper wavelength dependence was measured on the ground.
Note, however, that the absolute values of the predicted sensitivities are
about a factor of 10 higher than the values presented here.
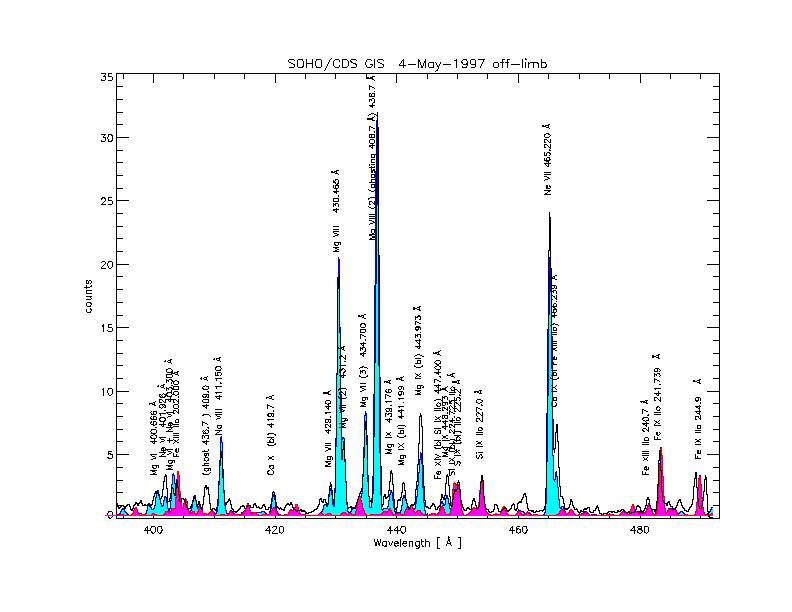
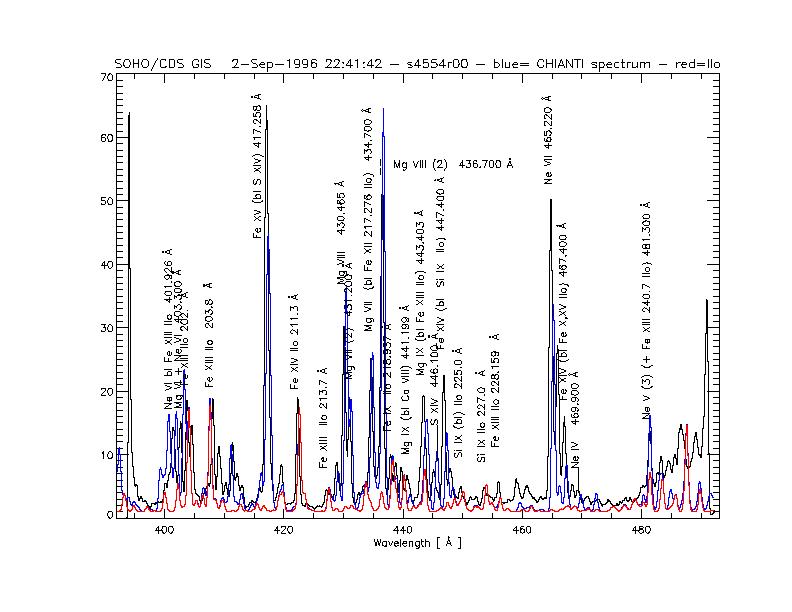
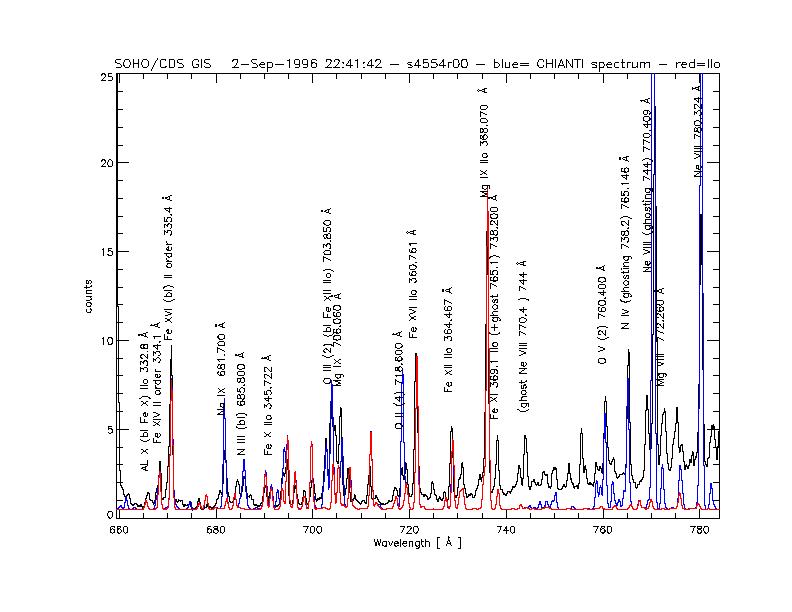
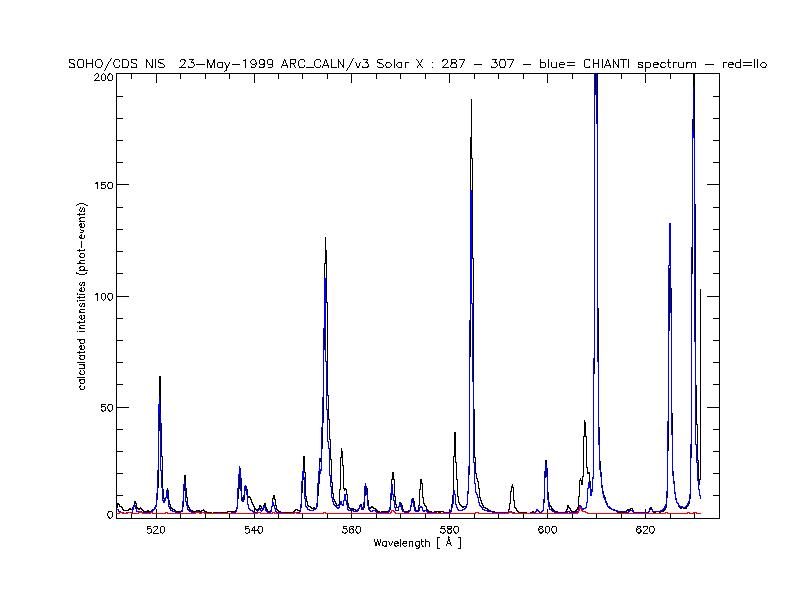
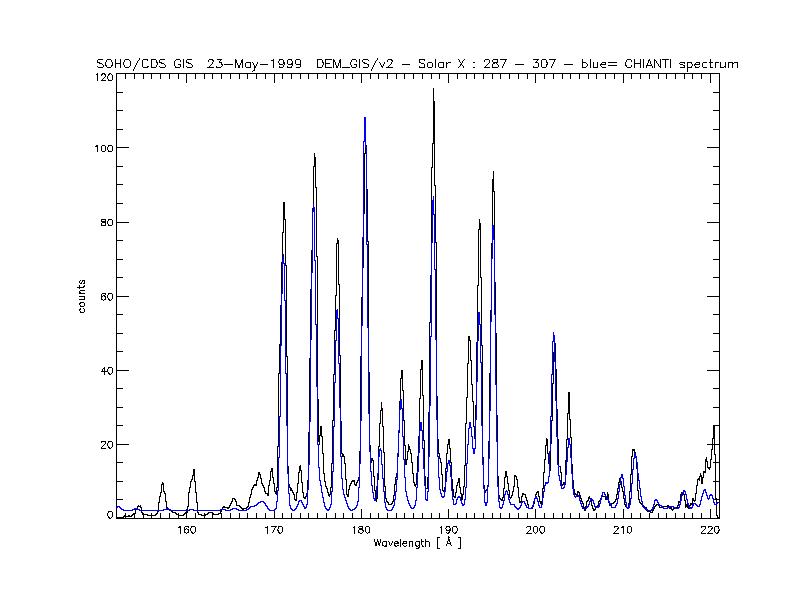
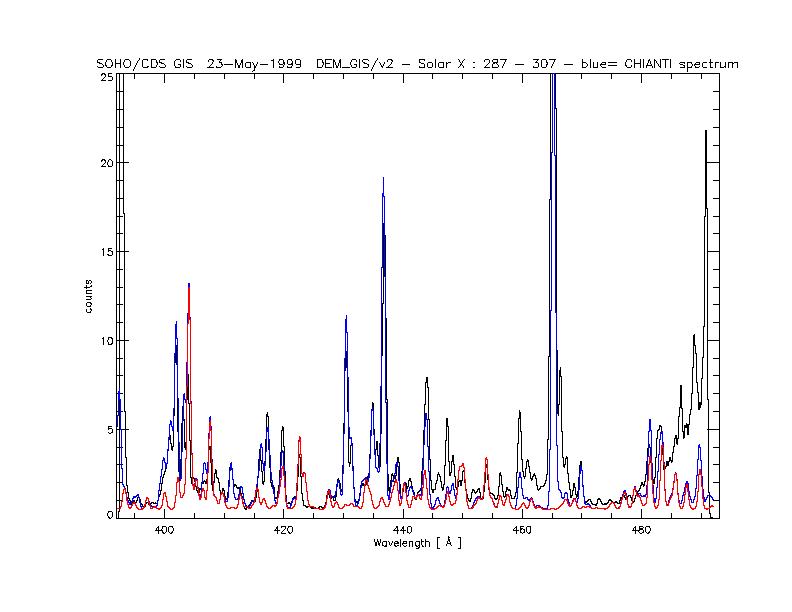
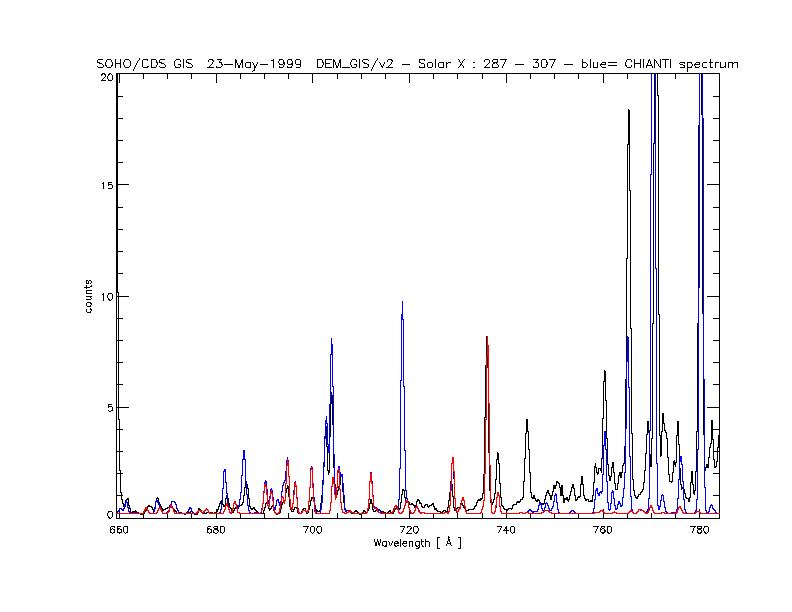
Now, a list of spectra (black), with superimposed
CHIANTI synthetic spectra (blue +shaded areas), with second order
contributions (red +shaded areas)
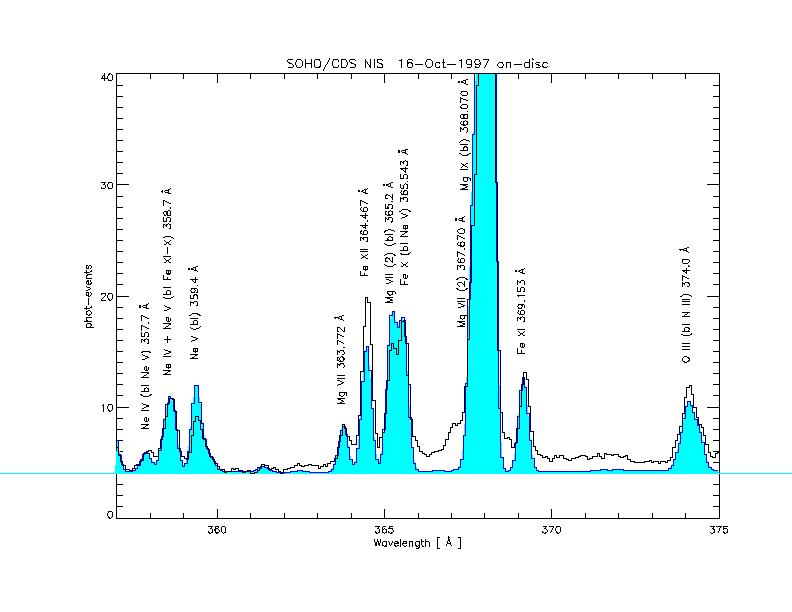
An on-disc observation of NIS 1, showing the few cool lines
used for the cross-calibration between the two NIS channels in first order.
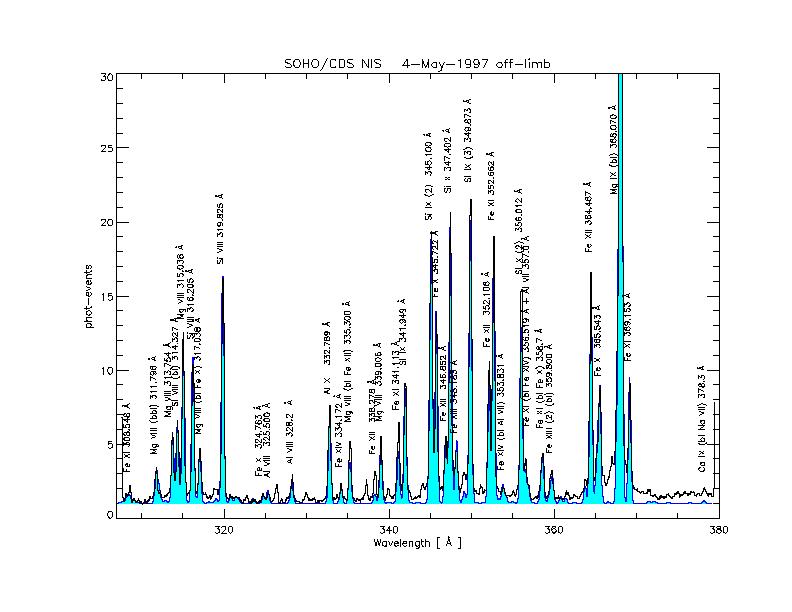
The NIS 1 spectrum of an off-limb quiet sun observation
(May 4th 1997), with corresponding synthetic spectrum
overlaid. These types of spectra have been mainly used for the
first order internal and cross-detector calibration.
Post-recovery:
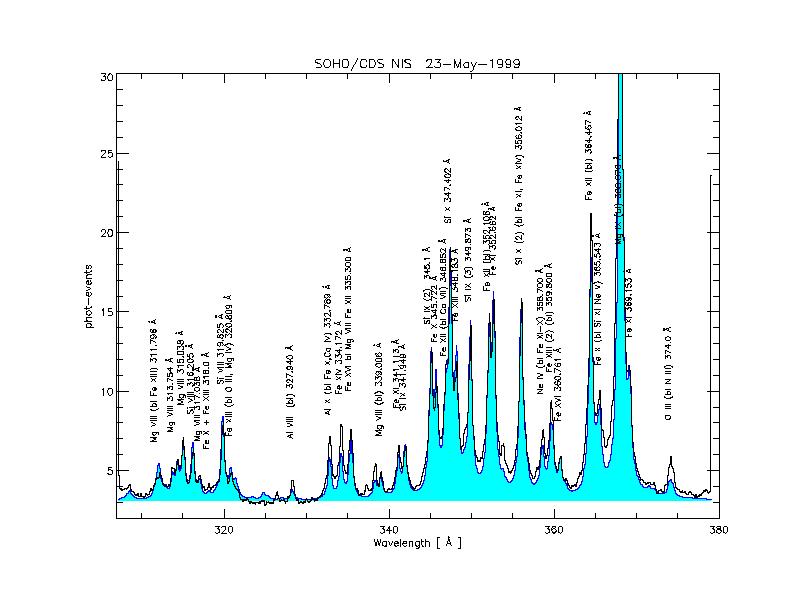
An NIS 1 spectrum after SOHO loss. Note the strong blending
of all lines, due to the broadened profiles.
Any NIS study that has extraction windows has to be analysed with
extreme care, because the background estimate is already problematic
in these full-wavelength spectra.

the NIS 2 spectrum of an on-disc quiet sun observation.
These types of spectra have been mainly used for the
first order internal and cross-detector calibration using cool lines.
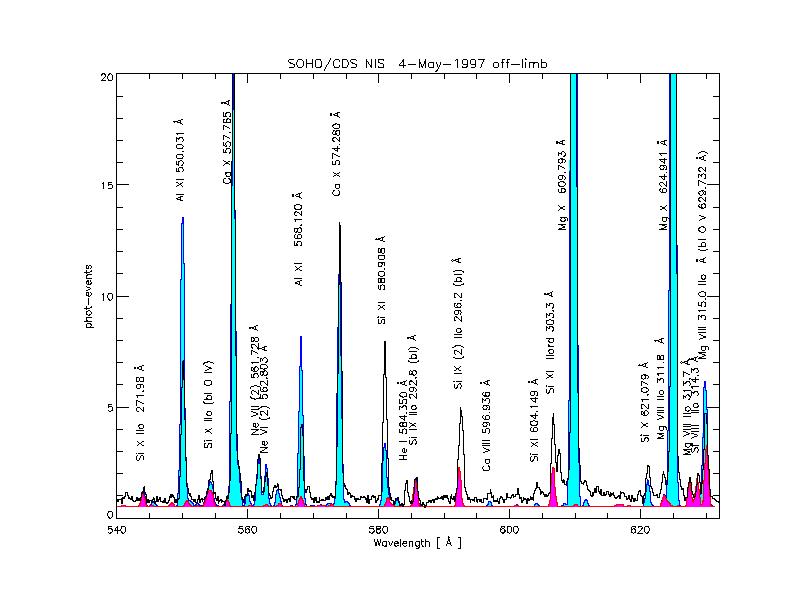
NIS 2 spectrum of an off-limb quiet sun observation.
These types of observations have been used to constrain:
a) the
NIS 2 first order calibration using coronal lines (e.g. Al XI, Ca X,
Mg X); b) the direct
second order calibration, using the same lines observed in first
order in the NIS 1 and GIS 2 channels.
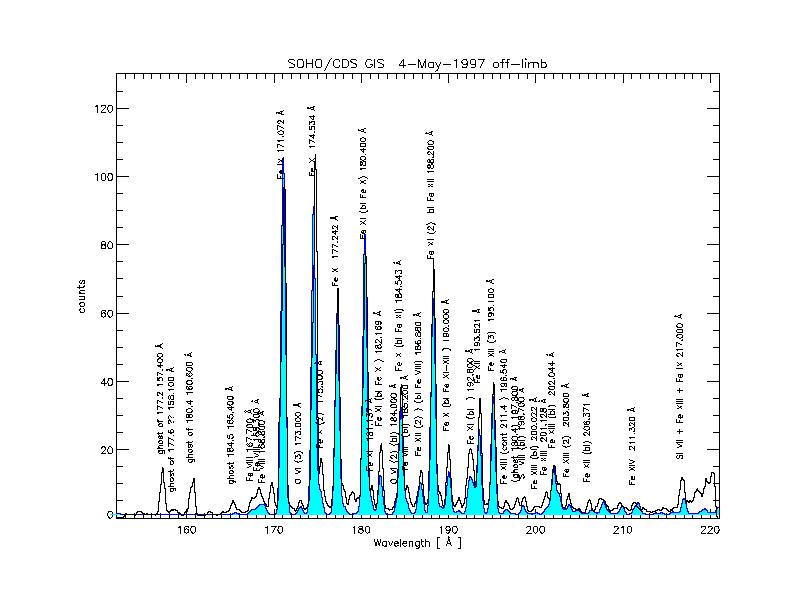
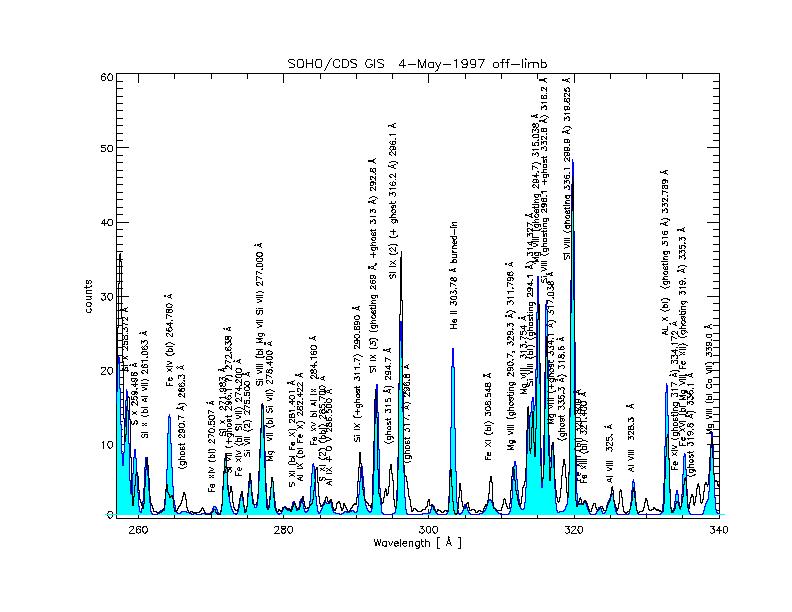
The GIS 1,2 spectra of an off-limb quiet sun observation.
These types of spectra have been mainly used for the
first order internal and cross-detector calibration.
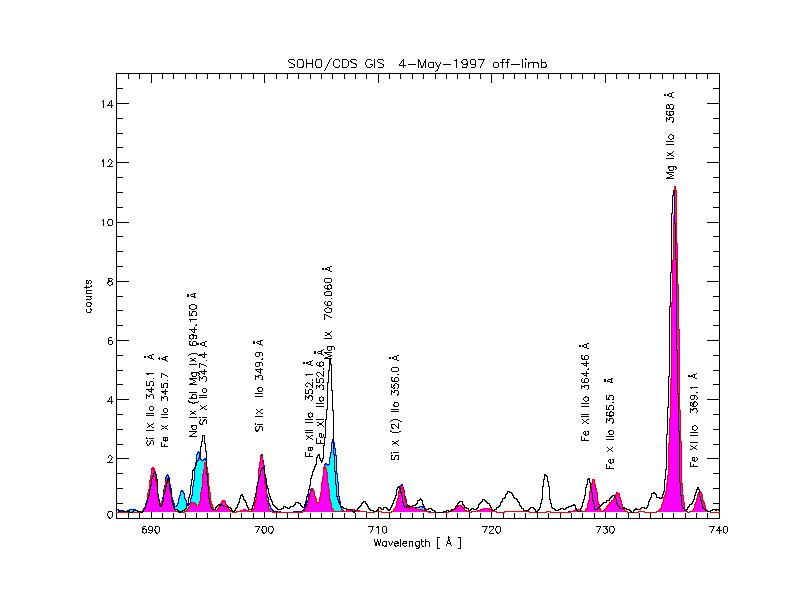
The GIS 3,4 spectra of an off-limb quiet sun observation.
These types of spectra have been mainly used for the
first order internal and cross-detector calibration,
and for the second order calibration.
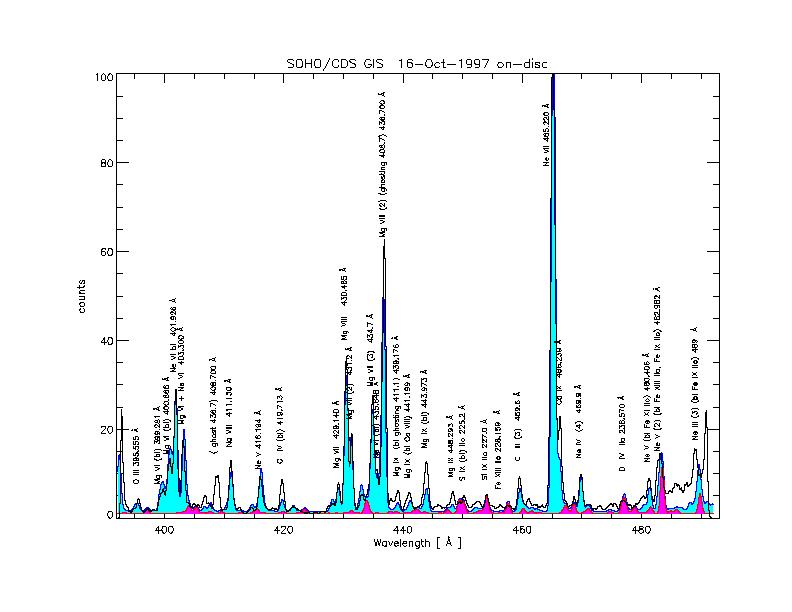
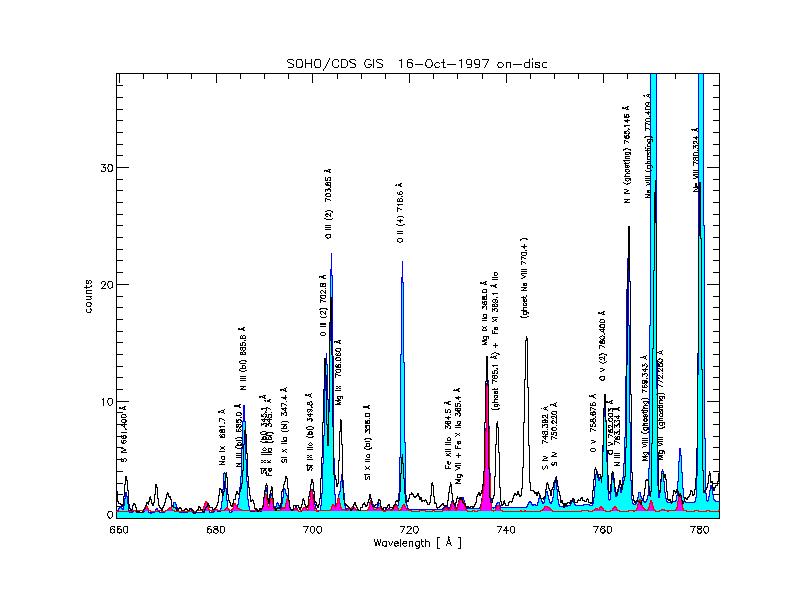
The GIS spectra of an on-disc quiet sun
observation
The GIS 3,4 spectra of an active region observation.
These types
of spectra were used to constrain the
second order GIS 3 sensitivity at shorter wavelengths, where a direct
cross-calibration with GIS 1 is possible, and
to constrain the
second order GIS 4 sensitivity with a direct
cross-calibration with GIS 2 and NIS 1.
Post-recovery:
The NIS and GIS post-recovery spectra. No obvious change
in the calibration seems necessary. The GIS spectra are as good as
those before SOHO loss !!!