11 Acknowledgements
I'm grateful to K. Phillips for providing calibrated SMM/FCS
spectra.
Financial support from PPARC is acknowledged.
12 Appendix: SXT filters
Here, I'm providing some SPEX - CHIANTI v.3
simulated SXT spectra for a test flare DEM.
The CHIANTI and SPEX emissivities have been
convolved first with this DEM, then with the
SXT effective areas in the various filters.
Intensity values are arbitrary.
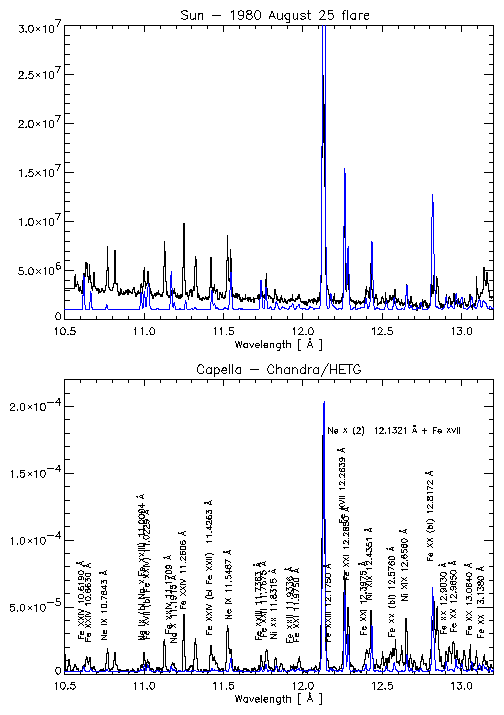
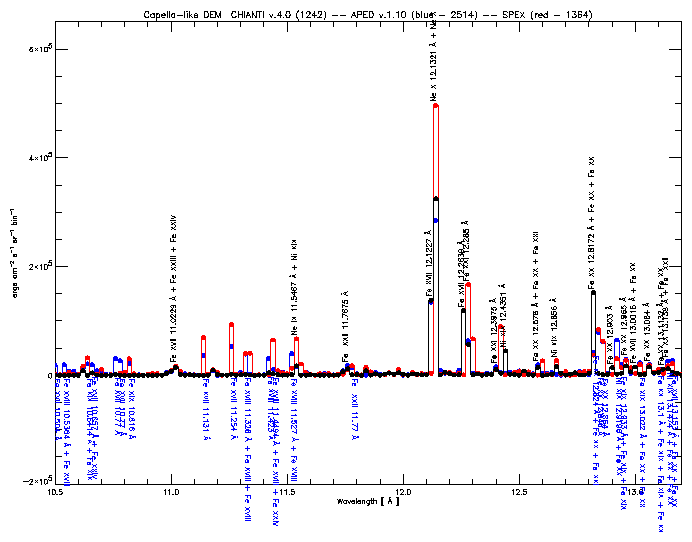
In the 10-12 A region, main differences are due to
Ne X and to the lines missing in CHIANTI.
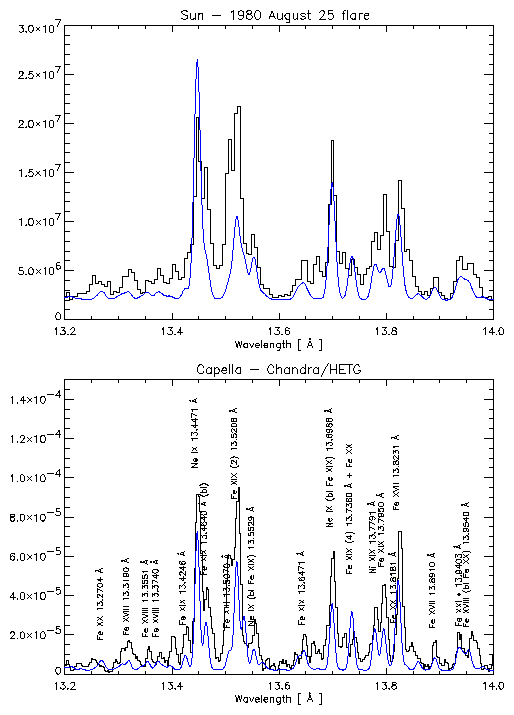
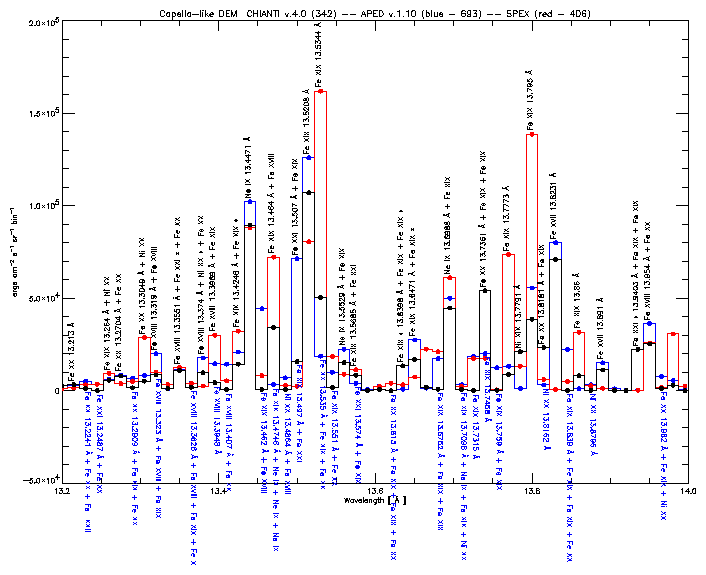
Major differences in the 13-14 A region
are due to Fe XIX at
13.5-13.6, and around 13.8 A.
In both cases, APED and CHIANTI are in good
agreement, but not SPEX.
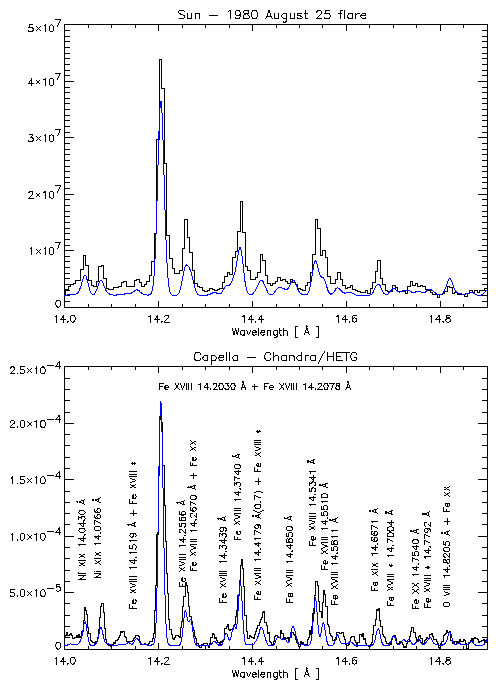
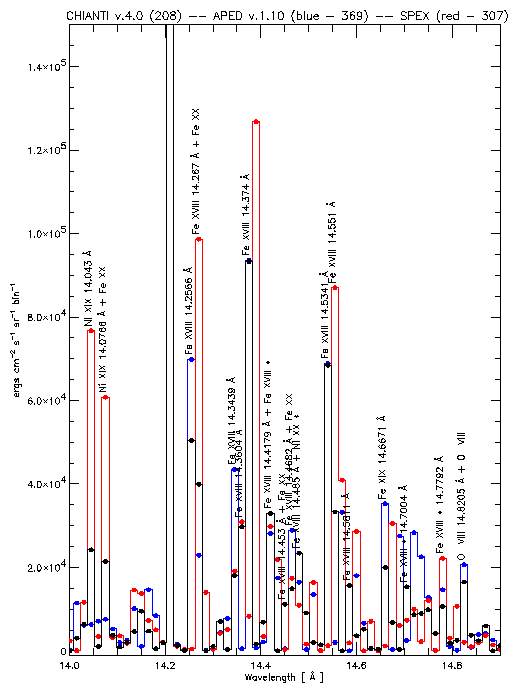
Around 14 A, main differences are due to
Ni XIX and Fe XVIII.
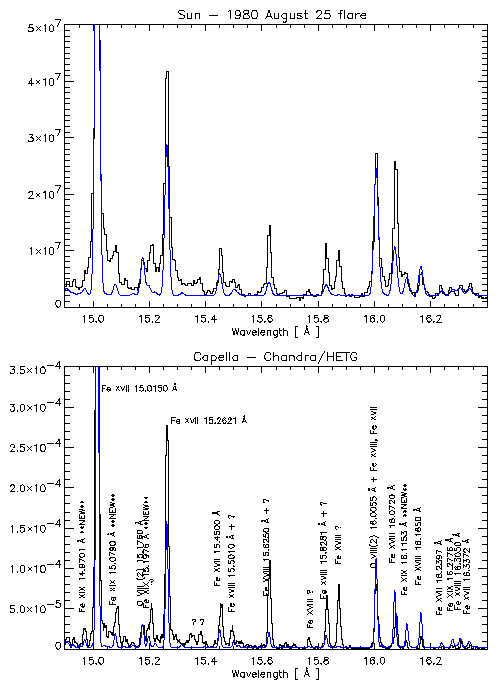
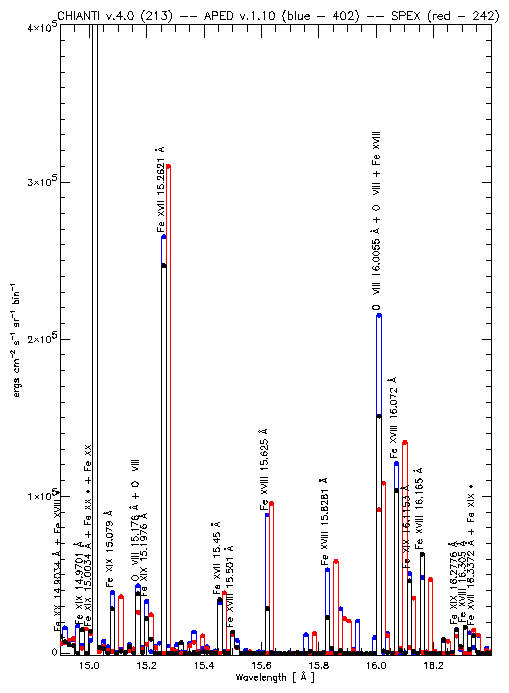
Around 15 A, some differences are
due to Fe XVII.
In the 10-12 A region, main differences are due to
Ne X and to the lines missing in CHIANTI.
Major differences in the 13-14 A region
are due to Fe XIX at
13.5-13.6, and around 13.8 A.
In both cases, APED and CHIANTI are in good
agreement, but not SPEX.
Around 14 A, main differences are due to
Ni XIX and Fe XVIII.
Around 15 A, some differences are
due to Fe XVII.
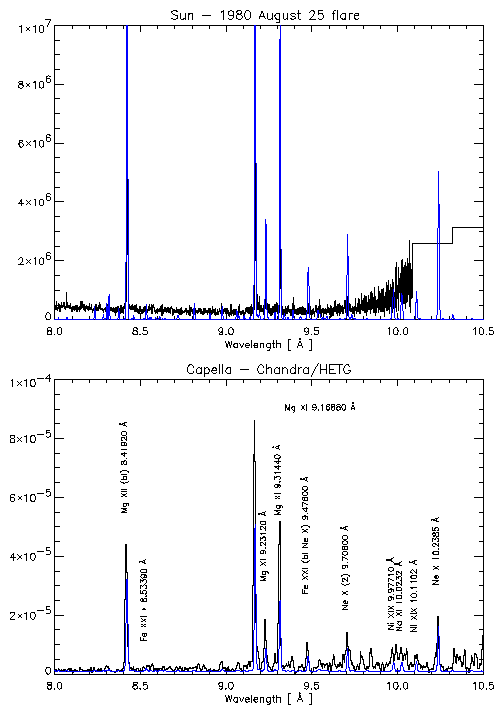
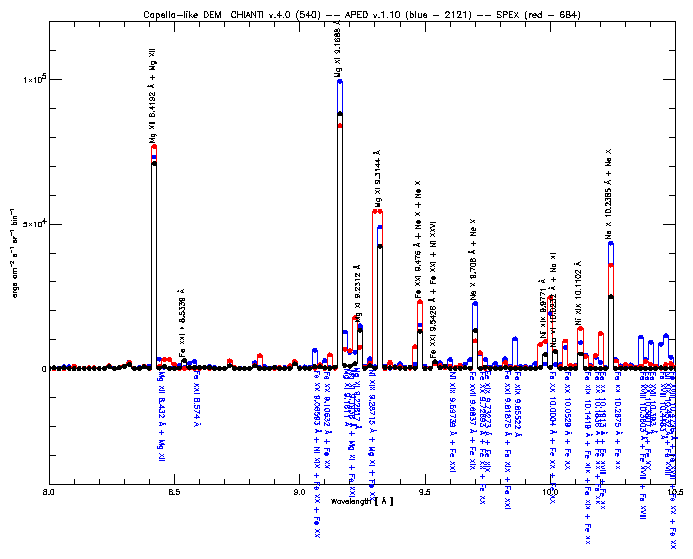
At 9 A, the differences are mainly due to a
single line in SPEX (?).
In the 10-12 A region, main differences are due to
Ne X and to the lines missing in CHIANTI.
Major differences in the 13-14 A region
are due to Fe XIX at
13.5-13.6, and around 13.8 A.
In both cases, APED and CHIANTI are in good
agreement, but not SPEX.
At 9 A, the differences are mainly due to a
single line in SPEX (?).
For the rest, differences are minor.
In the 10-12 A region, main differences are due to
Ne X and to the lines missing in CHIANTI.
Major differences in the 13-14 A region
are due to Fe XIX at
13.5-13.6, and around 13.8 A.
In both cases, APED and CHIANTI are in good
agreement, but not SPEX.
Around 14 A, main differences are due to
Ni XIX and Fe XVIII.
Around 15 A, some differences are
due to Fe XVII.