CHIANTI: application to X-Ray high-resolution spectroscopy
G. Del Zanna - DAMTP, University of Cambridge, UK
Sep 24, 2003
Abstract
The new Version 4 (released in 2002) of the CHIANTI atomic database and
software is briefly described. New atomic calculations
for ions important in the X-rays are included, together with proton
rates, new relativistic continuum calculations and photoexcitation.
The application of CHIANTI atomic data
to Chandra stellar X-ray spectra is presented,
together with comparisons with other spectral codes
such as APED and SPEX.
The definition of an accurate atomic database for
the X-ray wavelengths is of
great importance to the analysis and interpretation of
the high-resolution X-ray spectra that
the Chandra and XMM-Newton satellites are now providing.
CHIANTI is a collaborative project involving the
Naval Research Laboratory (Washington DC, USA), the
Universities of Florence (Italy) and Cambridge (UK)
and the Rutherford Appleton Laboratory (RAL, UK).
The CHIANTI package consists of a critically evaluated set of atomic
data and user-friendly software. It has unique features in many respects.
The atomic data
(energy levels, wavelengths,
radiative transition probabilities and excitation data) are stored in
ascii files.
The wavelengths are based on experimental data.
The energy levels are normally obtained from
NIST1 but often
supplemented by other laboratory values.
Lines for which only theoretical energy levels are available are
also provided.
The radiative data are taken from published literature and
where necessary, supplemented by new calculations.
Electron and proton collision strengths, taken from the
published literature, are scaled and stored in a compact form,
following [2].
All the atomic data in the CHIANTI database have been visually
displayed and assessed for accuracy.
The original sources are documented in each data file,
together with detailed comments.
The atomic data are kept up-to-date, and the details of each new
release published.
The atomic data are also provided directly on the WWW.
Note that for some ions CHIANTI provides more up-to-date atomic data
than NIST.
CHIANTI also includes a number of ancillary data such as
standard differential emission measures DEM,
elemental abundance and ionization fraction files,
and effective areas of many X-ray instruments.
User guides with explanations and examples are provided.
A number of Interactive Data Language (IDL) procedures are also
provided as part of the CHIANTI package. These include routines
to calculate ion level populations, line intensities, temperature-
or density-dependent line intensity ratios.
Synthetic spectra, eventually folded through effective areas
can be created. A package for DEM calculation is also included.
All the IDL routines are user-friendly (many have interactive
displays)
and have been documented with extensive headers
giving detailed descriptions and examples.
Modifications to the software are logged in a HISTORY file.
The CHIANTI package is
freely available at one of the updated CHIANTI homepages, e.g.:
http://www.chianti.rl.ac.uk/ (RAL, UK)
or via SolarSoft, a programming and data analysis
environment for the solar physics community:
http://www.lmsal.com/solarsoft/
Users are just asked to acknowledge CHIANTI
appropriately in any relevant publication.
If a detailed analysis with particular data is carried out,
it would also be appropriate to refer to the paper where the
original atomic calculations are presented.
The first version of CHIANTI was released in 1996
and is described in [6].
Since then, 3 other major versions have been published.
In version 3.0 [7], the package was extended to
the X-rays, by including atomic data for the hydrogen and helium
isoelectronic sequences, inner-shell transitions and satellite lines.
Important ions for the X-rays such as Fe XVII-XXIV were updated
with new atomic data. In particular, many new energy levels
were identified using the [16] compilation.
CHIANTI data are included (directly or indirectly) in many other
spectral codes, such as:
XSTAR (HEASARC/GSFC - USA); APED/ATOMDB (CfA, Harvard-Smithsonian -
USA); XSPEC (HEASARC/GSFC - USA); PINTofALE (CfA, Harvard-Smithsonian -
USA); Arcetri Spectral Code (Italy).
Users should check which CHIANTI versions are included in these
packages, so they
can trace back their results to the original atomic data source.
Version 4 of CHIANTI was released in Sept. 2002
[18].
A major change is the inclusion
of proton excitation data, principally for
ground configuration levels.
The inclusion of proton excitation changes the level balance within
the ground, and therefore directly affects the forbidden
transitions at the optical and infrared wavelengths, but also
indirectly affects X-ray lines, for a number of ions (such as Fe XXI).
Photoexcitation and stimulated emission are also included in v.4
by assuming a blackbody radiation field
when solving the level population.
Photoexcitation is very important at low densities when
its effects become comparable
with the other collisional excitation
processes, or whenever a strong radiation field is present.
New data (published in 2001 and 2002) for the X-rays have been
included in Version 4.
In particular, new collisional data from close-coupling calculations
for important ions that produce strong lines
observed by the Chandra and XMM-Newton gratings
(Fe XIX, Fe XX, Fe XXI, Fe XXII, Fe XXIII).
New Fe lines have been identified using the results of
[1] based on EBIT laboratory measurements.
The continuum routines have been re-written, including a new
relativistic free-free, and new free-bound and two-photon continua.
The relativistic thermal bremsstrahlung is based on
the analytical fits given by [8], while the
free-bound uses the the [10]
approximation to calculate the gaunt factors for
the photoionization cross-sections.
Users should be aware of what atomic data are included in the database,
and also of the approximations used.
In particular, it is assumed that the plasma is in steady
state, optically thin,
collisionally dominated and in ionization equilibrium.
Line emissivities are only accurate within certain temperature
ranges, as described in the CHIANTI papers that describe
each release.
Care should be used when applying the atomic data
for plasma diagnostic purposes (see [11]
for a review). In particular for any estimates that
strongly depend on the ionization fractions, such
as emission measures and elemental abundances.
In regard to the derivation of the chemical abundances,
note that most authors have used (and still use)
approximate approaches that sometimes result in large errors
[3,5].
In regard to estimates of emission measures and densities, note that
a large number of ions exhibit an
anomalous behaviour, which is still largely neglected in the literature.
When anomalous ions are used (for example as
they have been for the past two decades
for the studies of active stars
transition regions), incorrect results are obtained
[4].
CHIANTI will continue to grow and be updated in the future.
Planned research areas are:
develop procedures that account for non-maxwellian electron
distributions and non-ionization equilibrium; refined
photoexcitation models; new assessments for the X-rays;
inclusion of lines originating from levels n=3,4,5,6.
Any contributions and suggestions to the CHIANTI team are welcomed.
2 Direct comparison between widely-used codes and
observed X-ray spectra
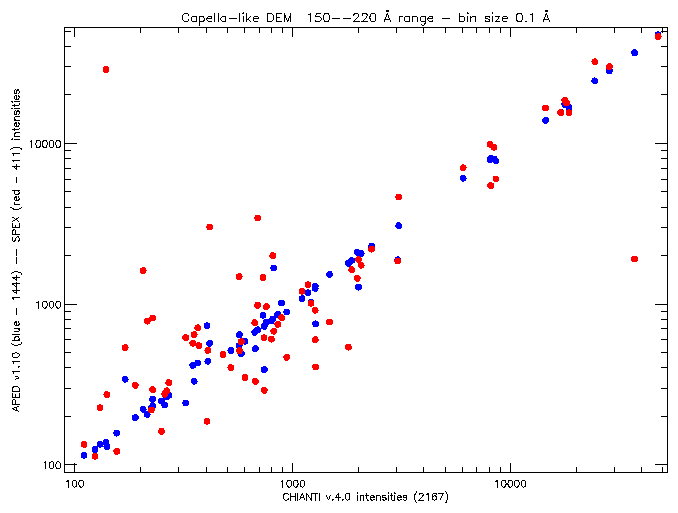
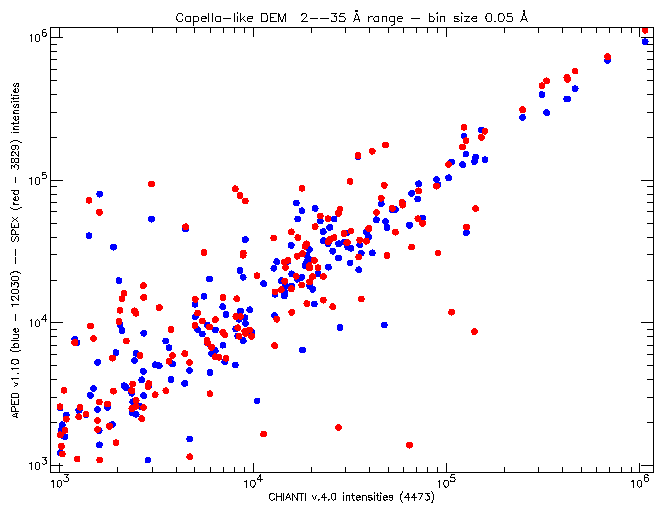
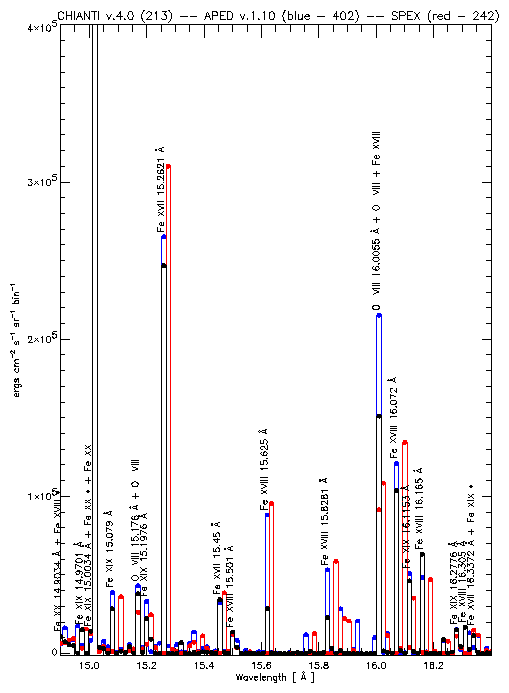
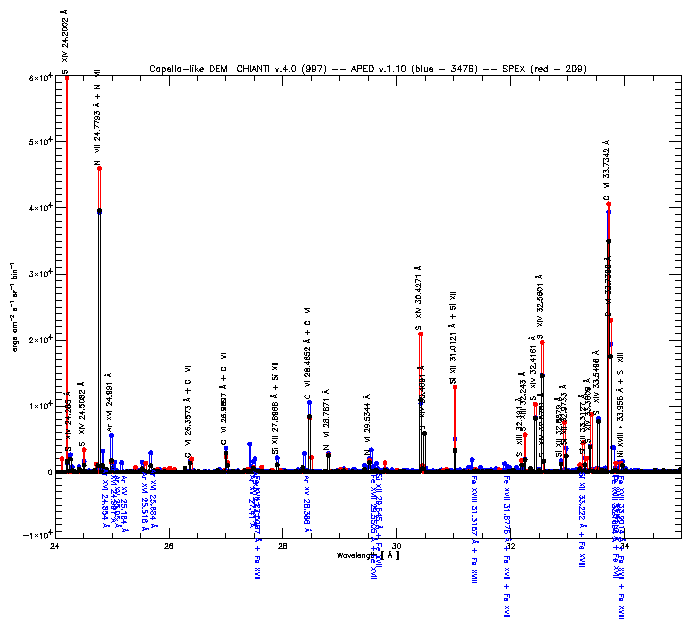
Figure 1: Plots of APED (blue) and SPEX (red) vs. CHIANTI Version 4 line
intensities,
for an EUV spectral region (top, 150-220 Å) and in the X-rays
(bottom, 2-35 Å).
There are very few published high
resolution solar spectra in the 1-50 Å range.
Solar spectra such as those of the SOLEX [12] and
SMM/FCS [14] spectrometers
were excellent in terms of spectral resolution,
but had some drawbacks for atomic benchmarking.
For example,
spectra were recorded by scanning over a wavelength range during solar flares,
when line intensities were changing by large factors.
There has been a lot of work with regard to
spectral line identifications and wavelengths adjustements.
For example, [15] revised
identifications and wavelengths of the lines in the MEKAL
spectral code.
However, much work is still required
in terms of line identifications and assesment of the
accuracy and completeness of presently-available atomic
data. For this, high-resolution,
high S/N and well calibrated spectra are needed.
The CHIANTI Version 3 was compared with observed spectra in the
1-50 Å wavelength range in order to test for accuracy and
completeness.
Paper IV [7] includes a comparative list between
CHIANTI-predicted lines and identifications and the
observed lines from published high
resolution solar spectra.
The great majority of X-ray lines are now included in the CHIANTI
database.
However, there are a number of lines for which
radiative data are available, but no collisional data have
yet been published. These lines are `missing' in the CHIANTI
database. They are mostly weak lines from Fe XVII-XIX
originating from n=3,4,5,6 levels. A list is provided in
[7].
Here, we present preliminary results based on
benchmarking the atomic data in CHIANTI Version 4
against two solar and stellar
high-resolution X-ray spectra.
The solar spectrum was recorded on 1980 August 25
in the 5 - 19 Å region
by the SMM/FCS in @ 18m [14].
The stellar spectrum is a composite of the publicly available
Chandra HETG Capella spectra extracted by D. Huenemoerder (MIT).
A differential emission measure analysis
was performed on the spectra,
in order to reproduce the majority of lines.
First, the idea was to compare three different atomic
codes, CHIANTI V.4, APED and SPEX.
CHIANTI undoubtely has far more accurate and up-to-date
atomic data, but the other codes are still widely used
by the astrophysical community.
The version 1.10 of the APED atomic database [17],
available through XSPEC was used.
This version included the entire CHIANTI v.2 database
and a collection of other sources for the X-rays, mainly
from HULLAC (Hebrew University/Lawrence Livermore Atomic Code) calculations.
The version 1.10 of the
SPEX [9] code, as available through
PintofAle2
was used. SPEX contains the
MEKAL (Mewe-Kaastra-Liedahl) line emissivities of the
original Mewe's code [13] with additions
of n=3,4 to n=2 transitions
from HULLAC calculations.
A detailed comparison is complex, for many reasons.
First of all, because line emissivities are strongly
dependent on the temperature, and partially dependent on the
density. Second, because the numbers of lines and their wavelengths are
different from code to code.
A few comaprisons, based on varying the DEM were performed.
The largest differences were found when considering
peak emission measures at temperatures where Fe XVIII is
formed. The DEM derived from the
Chandra Capella spectra was selected as example here.
Line emissivities of the three codes were folded with this
DEM distribution, and calculated assuming the same set of
parameters, i.e. ionization equilibrium,
densities and elemental abundances.
The resulting line intensities were then summed into
equal bins in wavelengths, for a direct comparison.
Obviously, in a few cases the same lines fall in different
bins because their wavelengths are different in the codes.
In the EUV, the comparison is satisfactory.
For example, in the 150-220 Å region, the deviations
between the CHIANTI-predicted intensities and those
from SPEX are small (see Fig. 1, top).
The APED vs. CHIANTI correlation is almost 1-1,
because APED contained almost exclusively
CHIANTI data in this spectral region.
In the X-ray region, larger differences are present, as
Fig. 1 (bottom) shows.
For the majority of lines, and in particular for the
brightest ones, the agreement between the codes is good.
For a lot of bins, the disagreements between SPEX and
CHIANTI are due to the same
10-30 mÅ wavelength shifts in the MEKAL lines found by
[15] and still
present in the currently available SPEX (some examples are given below).
The differences between CHIANTI and APED are partly due to
the fact that APED has a far larger number of lines, including
most of the `missing'
CHIANTI lines.
Other discrepancies are related to the large differences
between the atomic calculations used.
Figs. 11,13
show some selected wavelength regions,
where the above-mentioned differences are evident.
Finally, after having established in which cases the
differences between the various codes are more important,
the CHIANTI data have been compared directly with the
observations.
As a first approximation,
CHIANTI simulated spectra have been calculated
by convolving the line intensities with gaussian profiles
having fixed width.
A few sample spectral region are
displayed in Figs. 10,12.
For a few regions (as in Fig. 10),
the level of accuracy and completeness is good,
even down to the weaker lines, where experimental
energies (or wavelengths) have not been assigned yet.
For other regions (as in Fig. 12),
newly-assigned energy levels and wavelengths
are also in good agreement with the observations.
However, there is still a considerable number of
observed lines for which the disagreement is large.
In some of these cases, this is simply due to
`missing' lines. However, a large number of lines still
awaits proper identification.
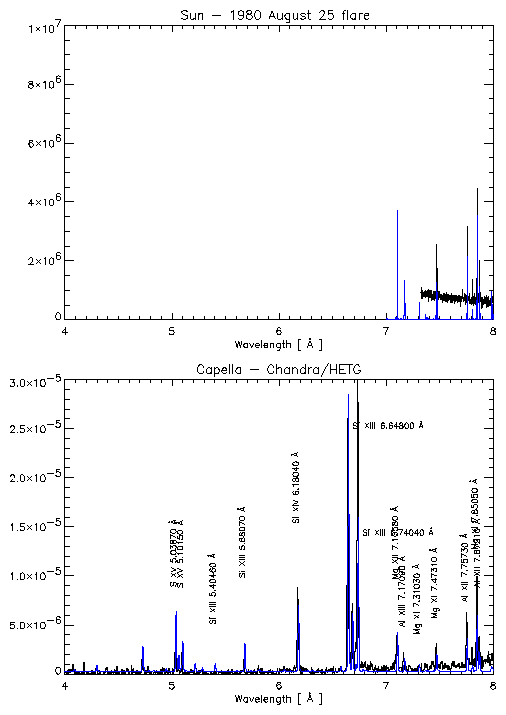
Figure 2: An SMM/FCS solar spectrum (above) and the
Chandra HETG spectrum of Capella in the 4-8 Å region.
CHIANTI v.4 simulated spectra are overplotted.
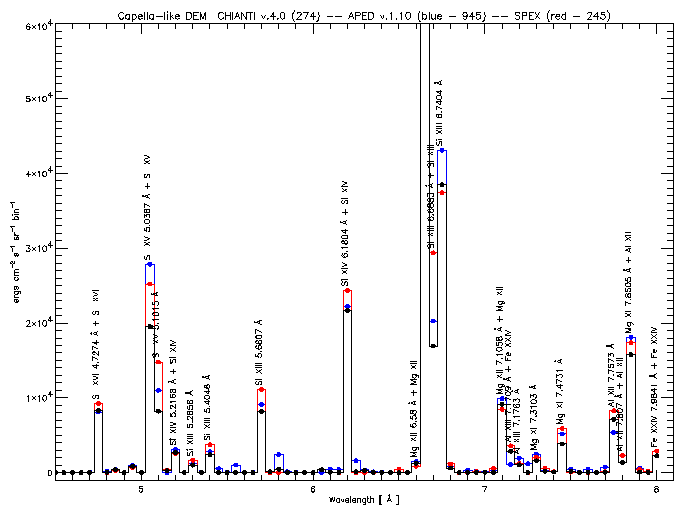
Figure 3: Comparison between APED (blue), SPEX (red), and
CHIANTI Version 4 (black) line
intensities in the 4-8 Å spectral region.
Line identifications are from CHIANTI. DEM as from Capella.
Note the good agreement between the codes.
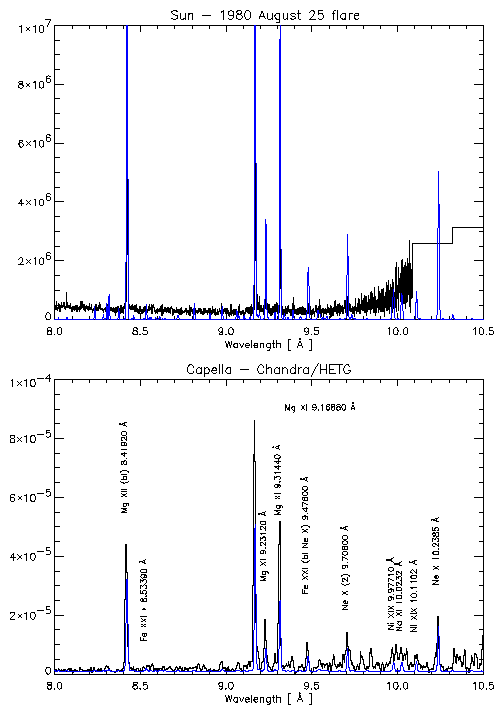
Figure 4: An SMM/FCS solar spectrum (above) and the
Chandra HETG spectrum of Capella in the 8-10.5 Å region.
CHIANTI v.4 simulated spectra are overplotted.
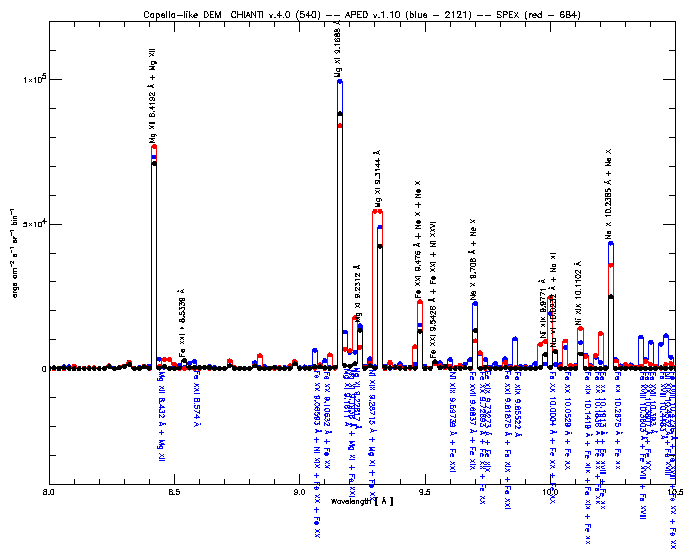
Figure 5: Comparison between APED (blue), SPEX (red), and
CHIANTI Version 4 (black) line
intensities. Line identifications are from CHIANTI. DEM as from Capella.
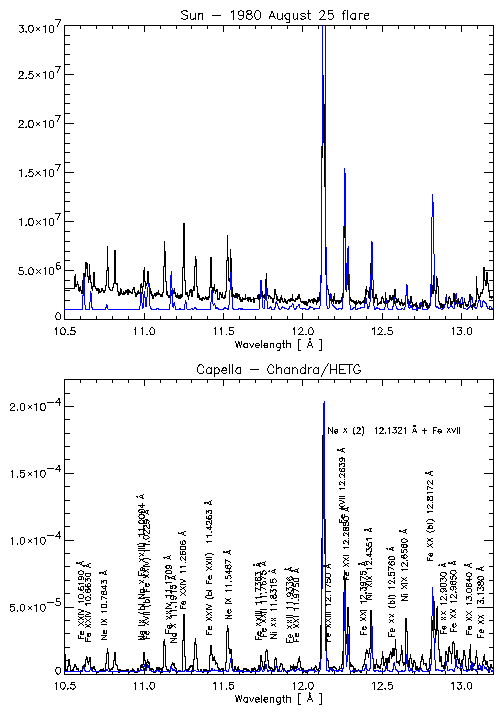
Figure 6: An SMM/FCS solar spectrum (above) and the
Chandra HETG spectrum of Capella in the 10.5-13.2 Å region.
CHIANTI v.4 simulated spectra are overplotted.
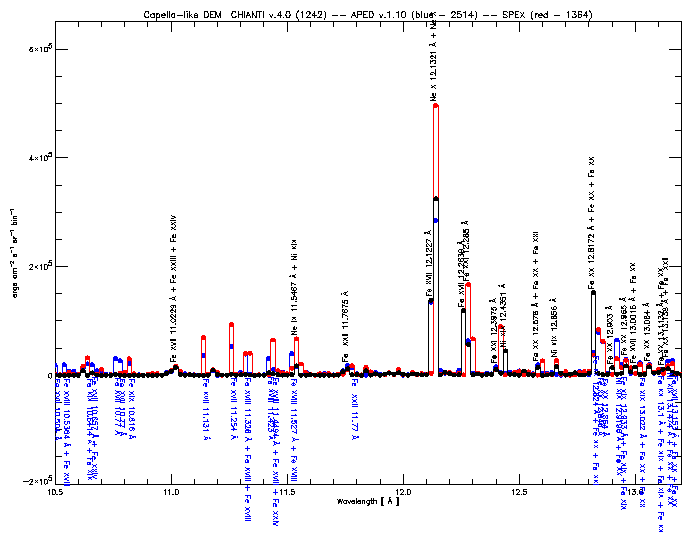
Figure 7: Comparison between APED (blue), SPEX (red), and
CHIANTI Version 4 (black) line
intensities. Line identifications are from CHIANTI. DEM as from Capella.
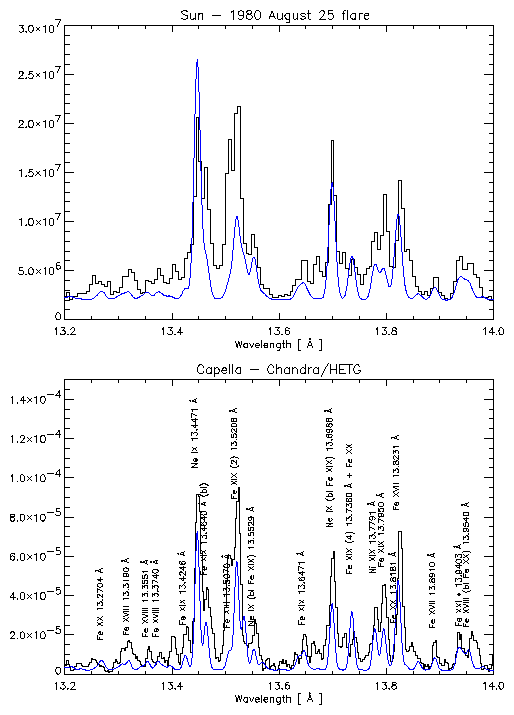
Figure 8: An SMM/FCS solar spectrum (above) and the
Chandra HETG spectrum of Capella in the 13.2-14 Å region.
CHIANTI v.4 simulated spectra are overplotted.
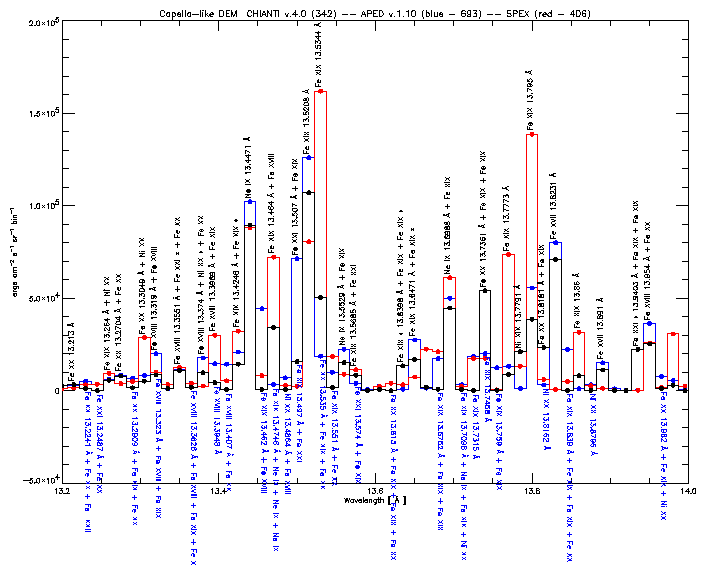
Figure 9: Comparison between APED (blue), SPEX (red), and
CHIANTI Version 4 (black) line
intensities. Line identifications are from CHIANTI. DEM as from Capella.
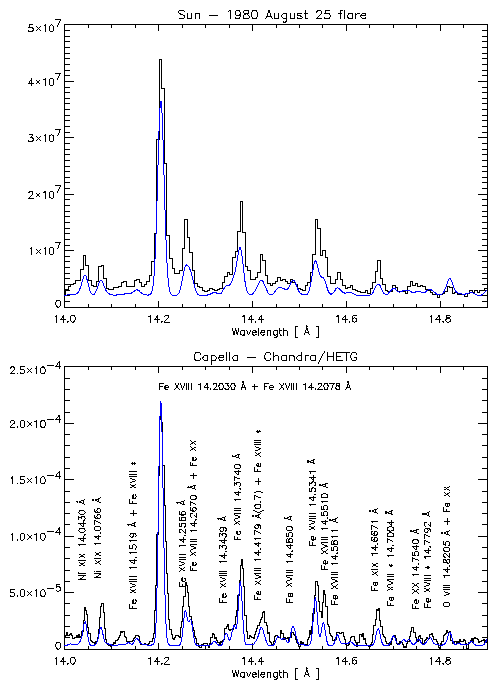
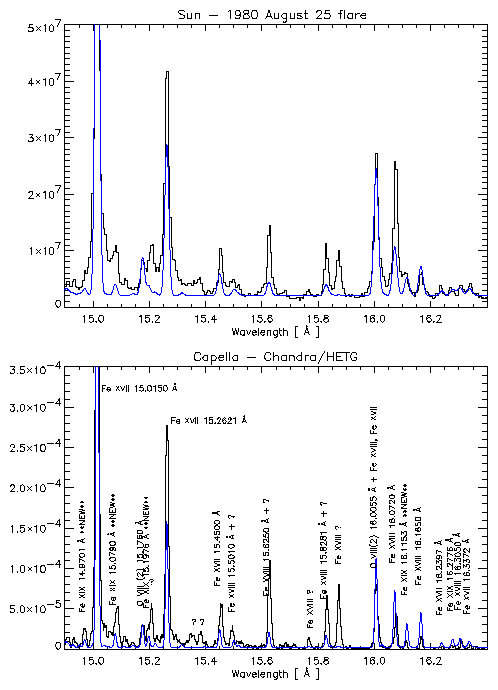
Figure 10: An SMM/FCS solar spectrum (above) and the
Chandra HETG spectrum of Capella in the 14-14.9 Å region.
CHIANTI v.4 simulated spectra are overplotted.
Note that most of the lines are identified.
Lines marked with an asterisk do not have experimental
energy levels.
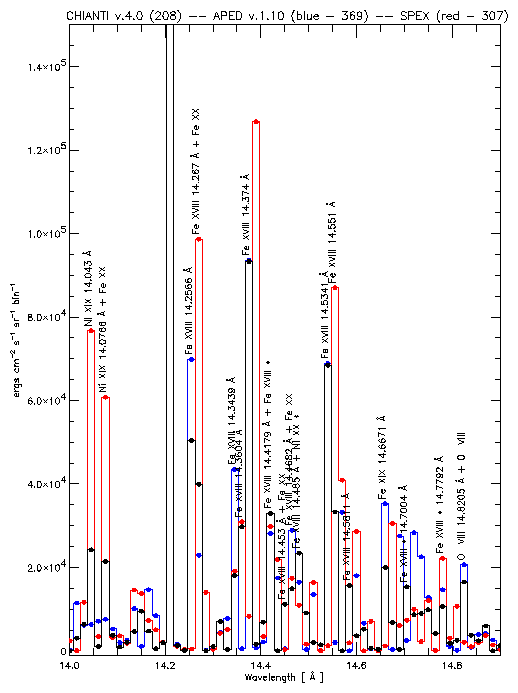
Figure 11: Same as Fig. 3 for
the 14-14.9 Å spectral region.
Lines marked with an asterisk do not have experimental
energy levels.
Note the relatively good agreement for most lines.
Some of the lines in SPEX are shifted in wavelengths.
Figure 12: An SMM/FCS solar spectrum (above) and the
Chandra HETG spectrum of Capella in the 14.9-16.4 Å region.
CHIANTI v.4 simulated spectra are overplotted.
Lines marked with **NEW** have new
experimental wavelengths (and energy levels) assigned in CHIANTI v.4,
and have corresponding observed lines.
On the other hand, there are many observed lines that
are still blends with unidentified lines.
Figure 13: Comparison between APED (blue), SPEX (red), and
CHIANTI Version 4 (black) line
intensities. Line identifications are from CHIANTI. DEM as from Capella.
Some large wavelength shifts in SPEX are evident.
SPEX and APED have a few of the lines `missing' in CHIANTI.
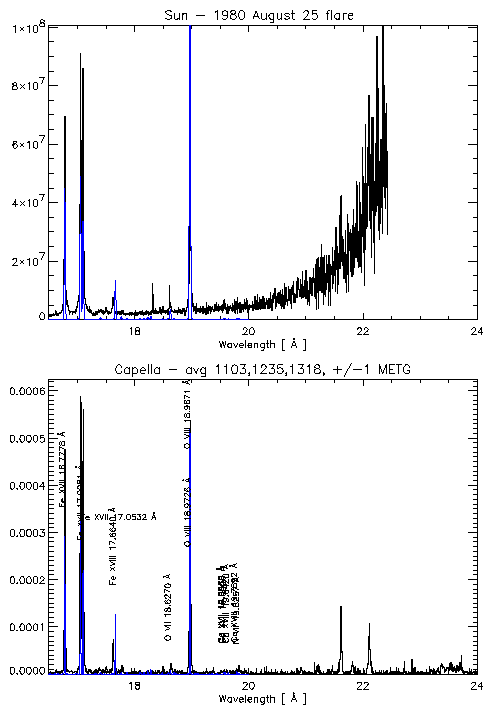
Figure 14: An SMM/FCS solar spectrum (above) and the
Chandra HETG spectrum of Capella in the 16.4-24 Å region.
CHIANTI v.4 simulated spectra are overplotted.
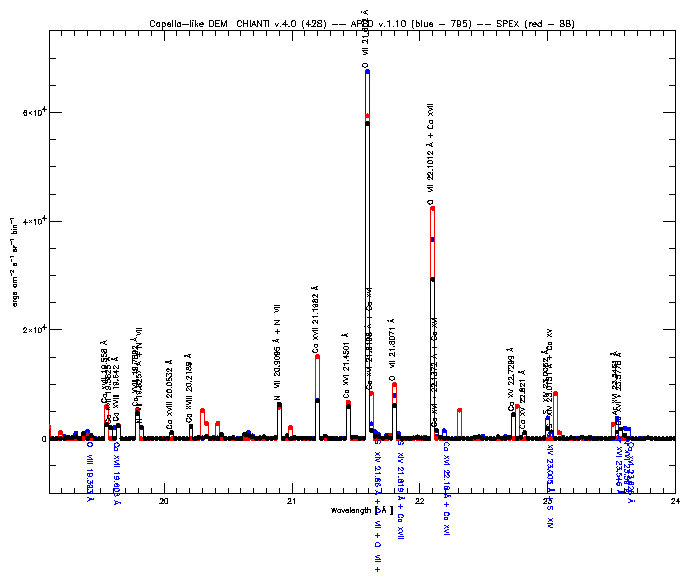
Figure 15: Comparison between APED (blue), SPEX (red), and
CHIANTI Version 4 (black) line
intensities. Line identifications are from CHIANTI. DEM as from Capella.
Figure 16: Comparison between APED (blue), SPEX (red), and
CHIANTI Version 4 (black) line
intensities. Line identifications are from CHIANTI. DEM as from Capella.
Figure 17: Comparison between APED (blue), SPEX (red), and
CHIANTI Version 4 (black) line
intensities. Line identifications are from CHIANTI. DEM as from Capella.
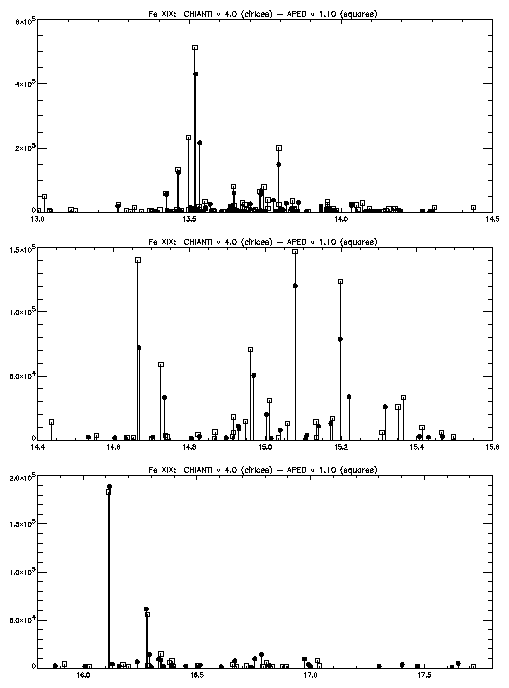
Figure 18: Comparison between CHIANTI Version 4 (cirles) and
APED v.1.10 (squares) wavelenghts and intensities.
Figure 19: Comparison between CHIANTI Version 4 (cirles) and
APED v.1.10 (squares) wavelenghts and intensities.
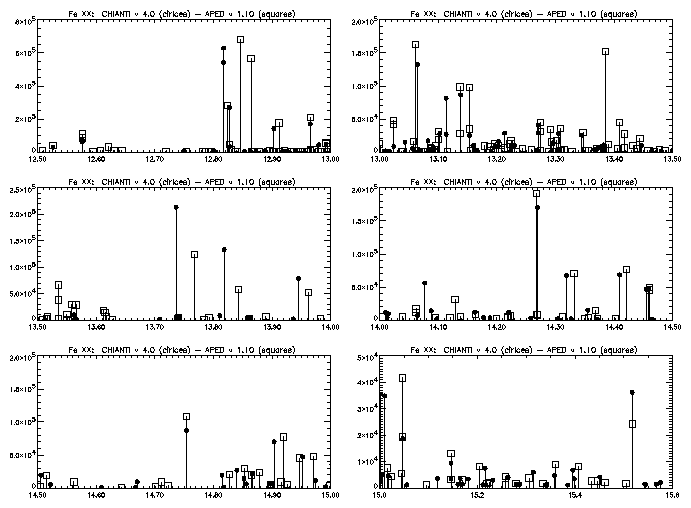
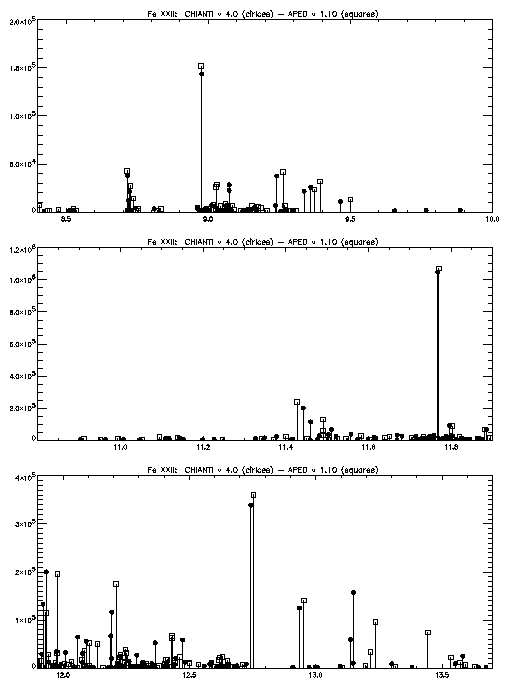
The figures presented in this Section present a comparison between
the wavelenghts and intensities of all the lines that are
present in the CHIANTI Version 4 (based on accurate R-matrix
calculations for Fe XIX,XX,XXI)
and APED v.1.10 (based on HULLAC DW calculations) databases,
ion by ion.
The main points are:
CHIANTI Version 4 is missing quite a few weaker
transitions (as we know).
The intensities of many of the brightest lines are in
quite good agreement.
The wavelenghts are not. In all cases, the
wavelenghts present in APED v.1.10 are in much better
agreement with observations.
The intensities and wavelenghts of most of the lines are
not in good agreement. Hence, the line identifications
based on HULLAC-laboratory data comparisons
cannot simply be included into CHIANTI.
Figure 20: Comparison between CHIANTI Version 4 (cirles) and
APED v.1.10 (squares) wavelenghts and intensities.
Figure 21: Comparison between CHIANTI Version 4 (cirles) and
APED v.1.10 (squares) wavelenghts and intensities.
Figure 22: Comparison between CHIANTI Version 4 (cirles) and
APED v.1.10 (squares) wavelenghts and intensities.
The comparisons between CHIANTI and other spectral codes has shown that
for the majority of the brightest lines the agreement is good.
The inclusion in CHIANTI version 4
of recent atomic data, in particular for the
Fe XVII-XXIV ions, provides a significant improvement in
our understanding of the X-ray spectrum.
However, there are still many
unidentified lines, and lines for which no atomic data are available.
The issue of completeness is extremely important,
considering that the majority of data taken by
Chandra and XMM-Newton are low-resolution spectra.
Kaastra J.S., Mewe R., Nieuwenhuijzen H., 1996, in: UV and X-ray Spectroscopy of Astrophysical and Laboratory
Plasmas, Yamashita K., Watanabe
T. (eds.). Universal Academy Press, p. 411