Eigenvalues and Eigenvectors
It is often crucial to be able to compute eigenvalues and eigenvectors of a given system, and having an arsenal of numerical methods to do so, especially in those cases where exact computations are highly impratical to perform, can be essential.
Contents
Where to find the methods in the notes
We are mainly going to discuss three methods: power method, inverse method and QR algorithm. The Power Method is method 5.2 (Lecture 22), the Inverse Method is method 5.5 (Lecture 22), and the QR algorithm is method 5.13 (Lecture 23) in the notes.
The aim of this GUI
The aim of this GUI is to compare different iterative methods to compute eigenvalues and eigenvectors of a given matrix  . In particular, we will compare the performances of the power method (without and with constant shifts), of the inverse method, and of the QR algorithm (without and with constant shifts).
Running the downloadable MATLAB® code on this page opens a GUI which allows you to play with the above methods. Here is the GUI.
eigenstuff_GUI
   -2.4120

   -2.1400

   -1.2380

   -0.2237

   -0.1772

    0.1705

    0.4188

    0.5325

    1.2116

    2.5563
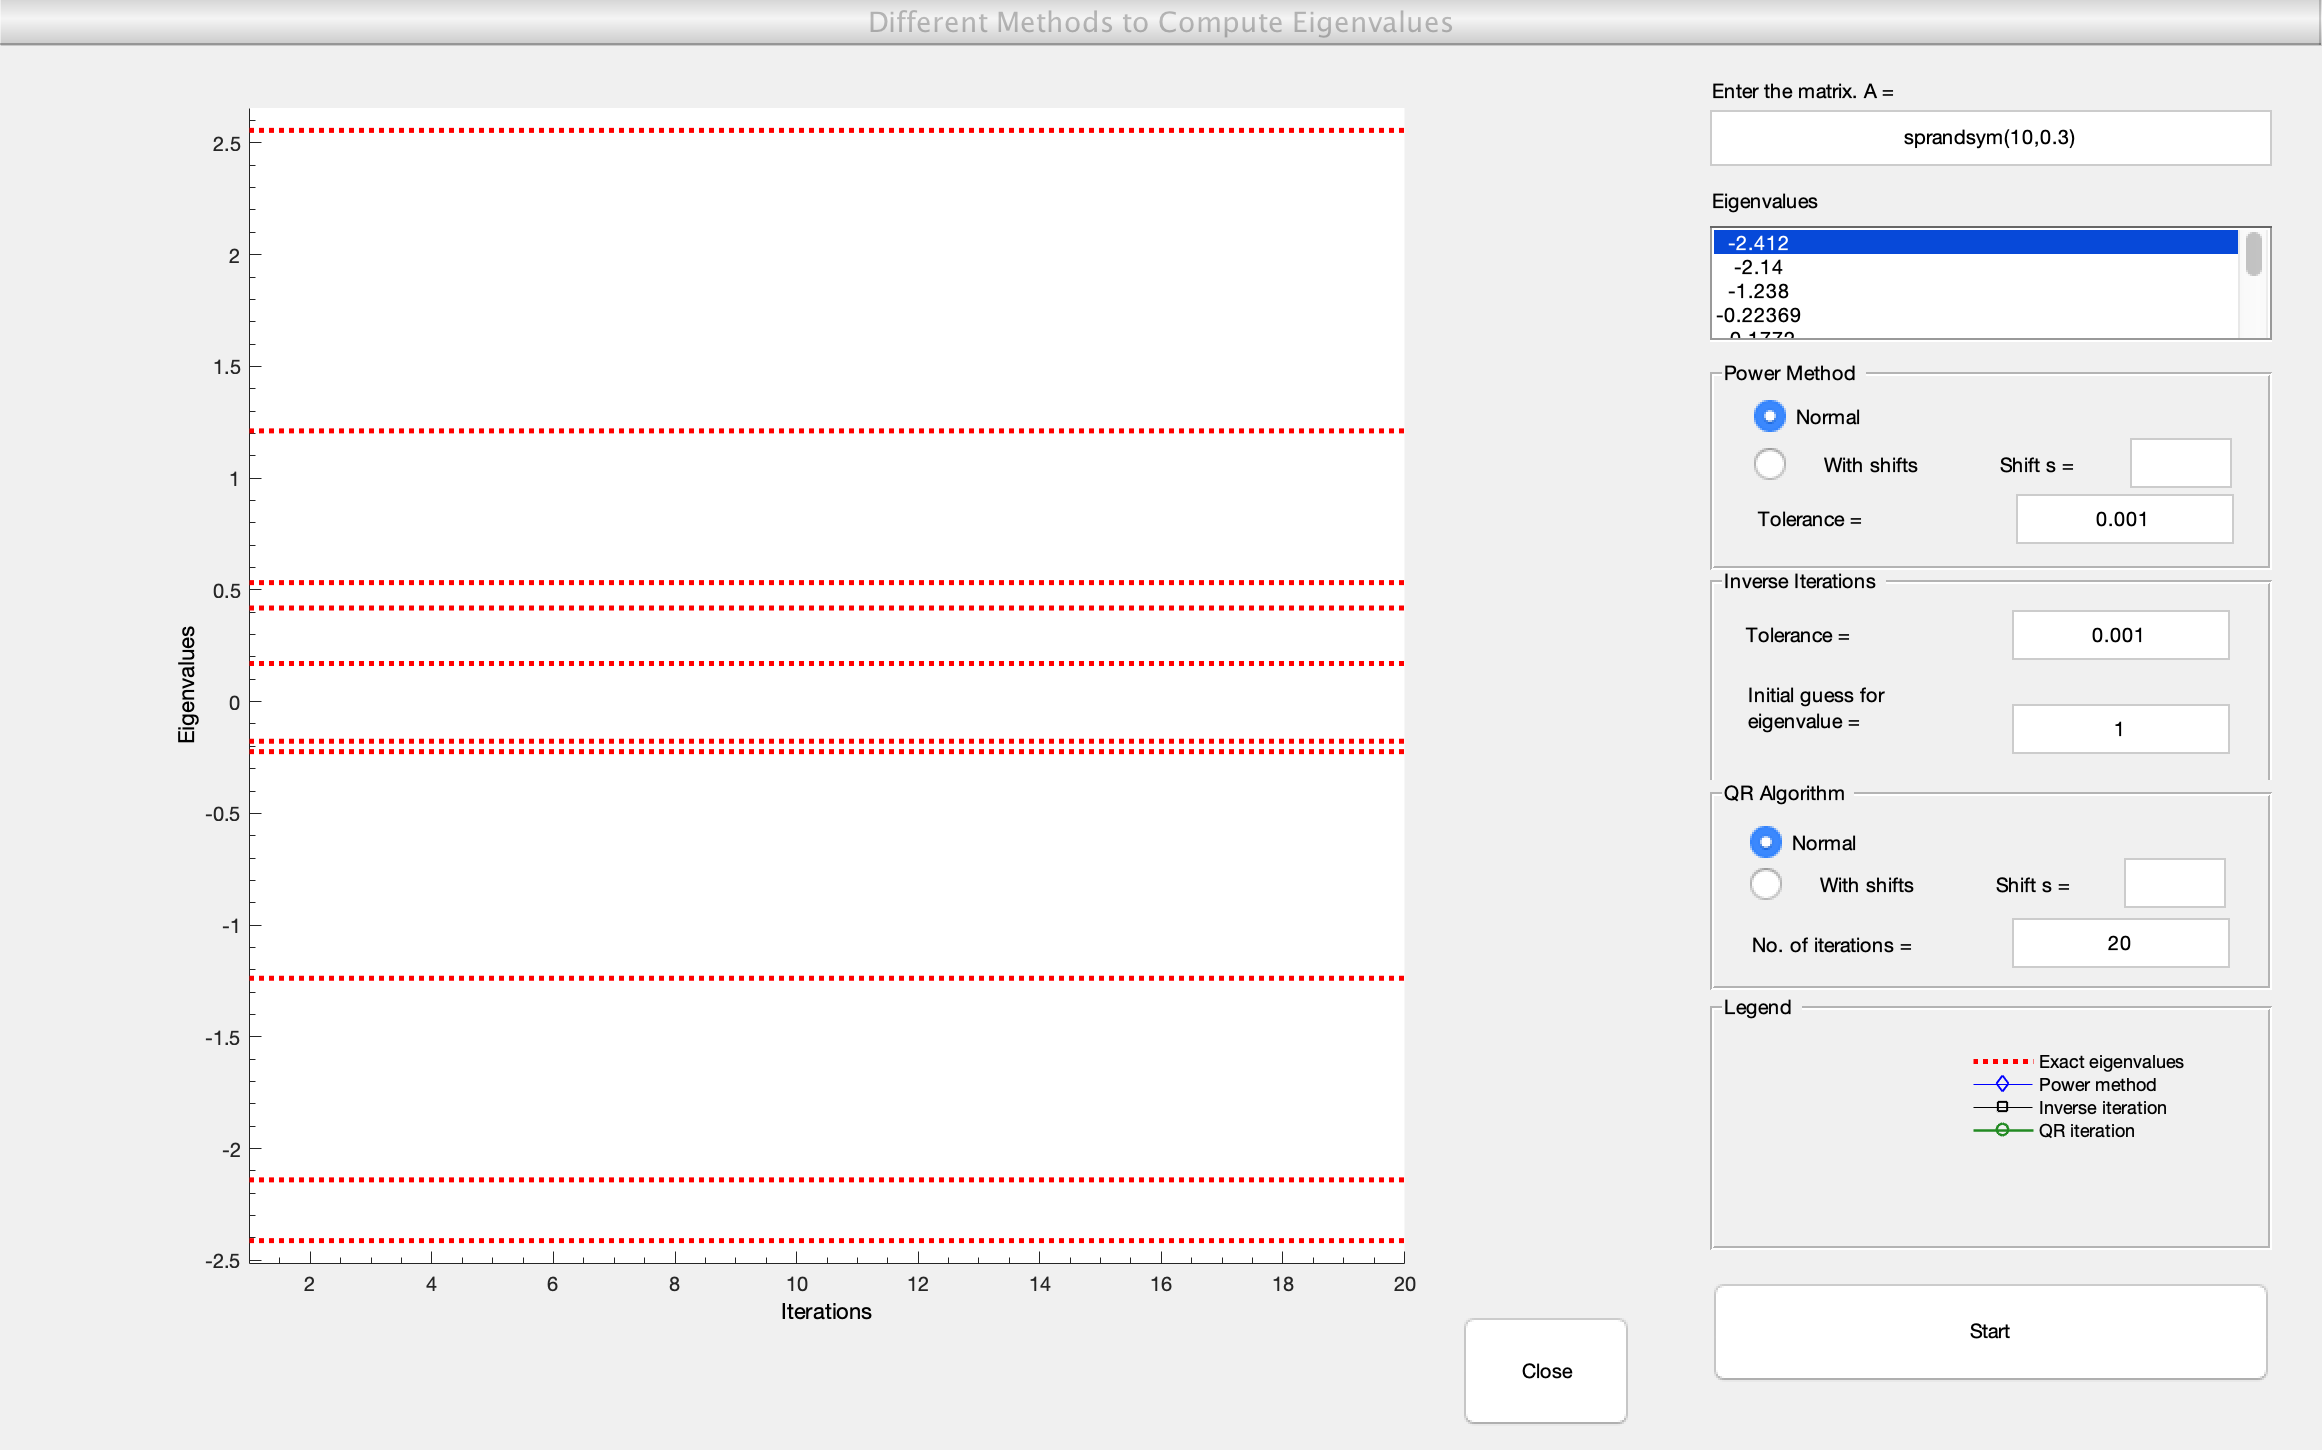
Interface
You can input any square matrix having real and distinct eigenvalues. A displayer of the eigenvalues of the matrix is there to see if your input matrix satisfies the required conditions. Also, the eigenvalues are displayed as horizontal dotted red lines in the graph on the right.
For each available method, you have some options. For the Power Method one, you can either run the 'normal' algorithm, or use constant shifts, which you should specify; you can also change the tolerance. The same things apply to the QR algorithm, with the difference that, instead of the tolerance, you should specify the number of iterations you want to see. For the inverse method, you should input an initial guess of the value of the eigenvalue, and you can also set the tolerance.
Once you are happy with the settings, click on the 'Start' button. You will see how the methods converge and to which eigenvalues. As soon as the methods hit the eigenvalue within the set tolerance, or after the set number of iterations, they stop and plot vertical dotted lines which should help in counting the number of iterations done.
If you want to change the settings, do so and then hit 'Start' again. If you want to change matrix, just input it - the graph will be automatically updated.
Code
- eigenstuff_GUI.m (Run this)
- eigenstuff_GUI.fig (Required - GUI figure)
All files as .zip archive: eigenstuff_all.zip