Two input images are created such that 4x4 patch in left image and 4x4 patch in corresponding region of right image represent two numbers (x and y) in binary format. The binary number is ordered on a row by row basis within the 4x4 patch with bit 0 (lsb) in the top left hand corner and bit 15 (msb) in the bottom right hand corner of the image patch. The sum of these two numbers, z = x+y, varies in a smooth fashion across the surface of the image. z is initially chosen in the range [0,1] and then scaled by 2**16. Given z, we chose x to be a random value between 0 and z, and then we set y = z-x.
A three-layer network was used, with 2x4x4 inputs going to a hidden layer of 3 tanh units and 1 output unit. Half-lives for averaging: U=1, V=500.
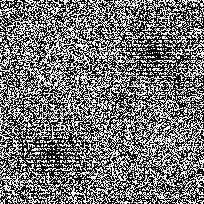
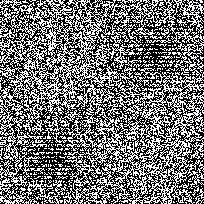
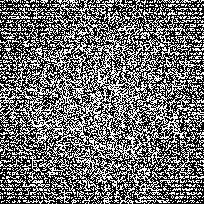
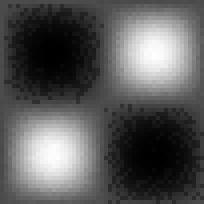
The inputs to the network are the following two binary images (no smoothing or normalisation of input patches):
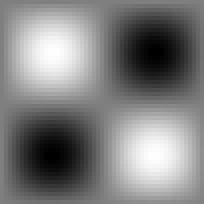
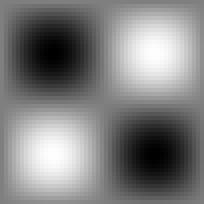
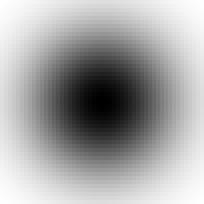
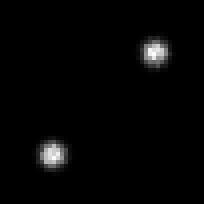
The sum of the two patches in each image has an "egg-box" profile (shown on the left). Network performance after 200 epochs is shown on the right.
[All images here are jpegs which accounts for the poor quality on some of the graphs.]
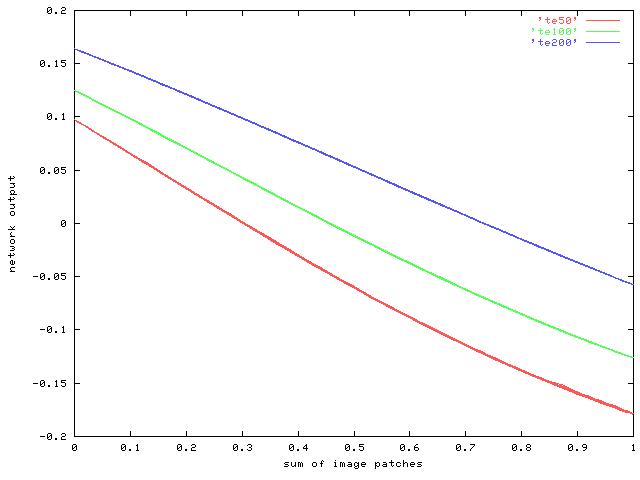
This plot shows how the network output varies with the desired sum of the input patches after 50 (red), 100 (green) and 200 (blue) iterations. As the line gets straighter during learning, the range of output values is reduced slightly.
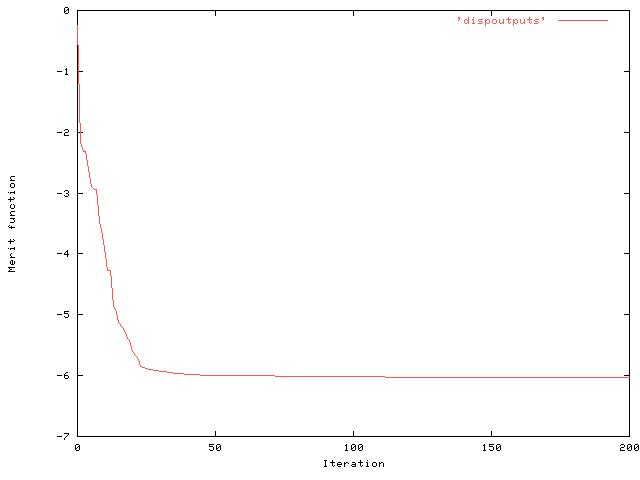 Note this is a very low value of the merit function -- typically we
used to see values of around 1.8 for the disparity test and around 0.9
for the feature orientation. [It is negative since we are taking logs
and the value V/U has gone below 1.0.]
Note this is a very low value of the merit function -- typically we
used to see values of around 1.8 for the disparity test and around 0.9
for the feature orientation. [It is negative since we are taking logs
and the value V/U has gone below 1.0.]
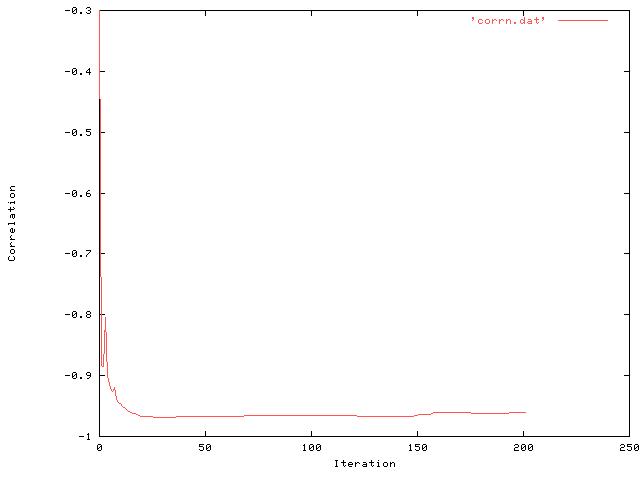 Note that the correlation reaches a very high value (-0.97) fairly
quickly before decreasing slightly at the end to around (-0.96).
Note that the correlation reaches a very high value (-0.97) fairly
quickly before decreasing slightly at the end to around (-0.96).
Inputs are just the binary values (no smoothing or normalisation of input patches):
The sum of the two patches in each image has a Gaussian profile (shown on the left). Network performance using network trained on egg box data above is shown the right. Correlation between the two is -0.998 (v. good!).

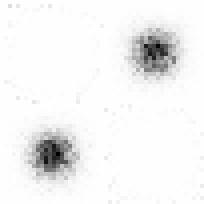
In this case, the merit function reached a stable value of -0.8 after around just 10 epochs. When tested on the unseen Gaussian images, correlation was very high (-0.97).
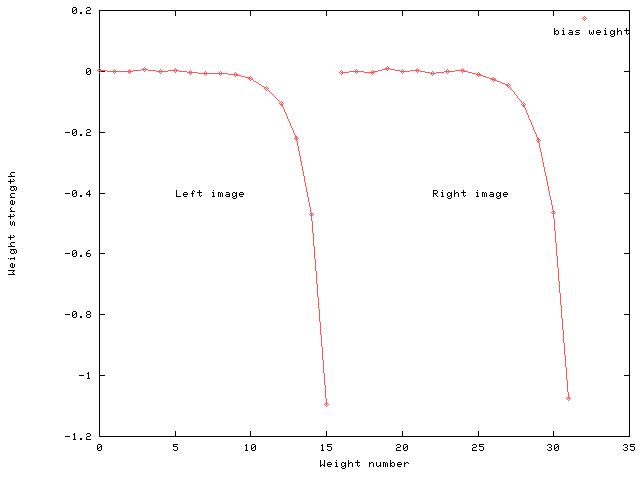
Weights 0-15 are the connections from the left image patch to the output unit, and weights 16-31 are the connections from the right image. There is also a bias weight (32). The network has least weight strength for the least significant bit of each number and increasing weight strength for successive bits of each number. To test which weights in the network were important for the task, once the network had been trained on the egg-box data, various weights were set to zero to see how much each weight contributed towards network performance.
| Non-zero weights | r |
| 15 | -0.667 |
| 14-15 | -0.912 |
| 13-15 | -0.963 |
| 12-15 | -0.971 |
| 9-15 | -0.969 |
| 0-15 | -0.968 |
This can be seen if we test the network with a set of inputs that do not make use of the full range [0..2**16] of possible values of z. (This is using the network trained on the egg-box data with a full-range [0..2**16] of values for z.) The table below shows the correlation for different ranges of z in the test images. So, when the input images only code sums in the range [0..2**8], the correlation between output and desired output is very low (-0.174) and is expected. As the range of possible values for z increases back to [0..2**16], network performance returns to normal.
| [0..2**n] | r |
| 8 | -0.174 |
| 10 | -0.466 |
| 11 | -0.532 |
| 12 | -0.805 |
| 13 | -0.944 |
| 14 | -0.986 |
| 15 | -0.998 |
| 16 | -0.978 |