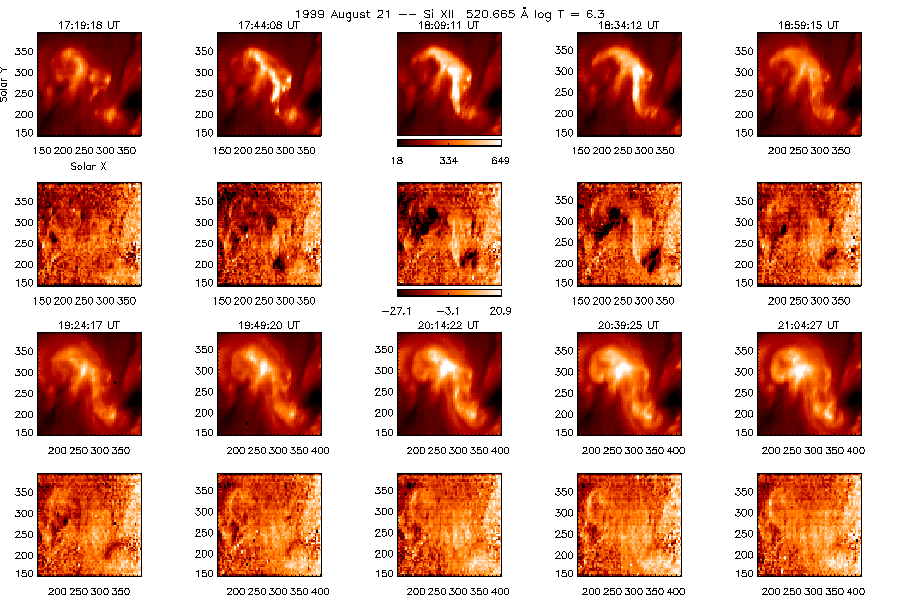
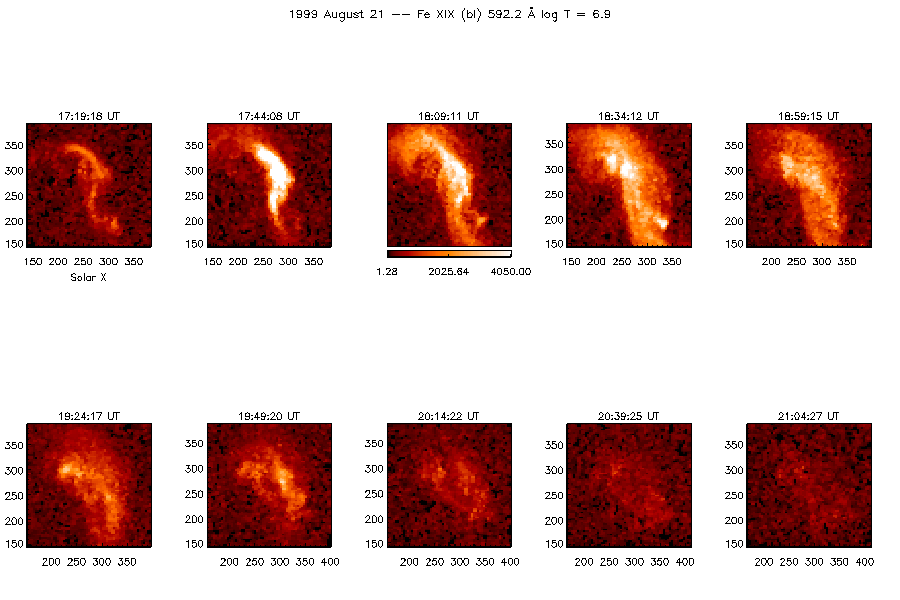
During the third Whole Sun Month Campaign (August 18 - September 14, 1999), the evolution of the Active Region NOAA 8668 was followed during its meridian passage and at the limb, with simultaneous observations with SOHO and other instruments, both satellite and ground-based. This active region presented a sigmoidal (S-shaped) structure as seen in the X-rays, had a filament associated with it, and was very active.
On August 21st, a small flare occurred (at @ 17:40 UT). This was associated with a brightening of the sigmoidal structure and a later disappearance of the filament.
Details can be found in Del Zanna et al. (2002) and Gibson et al. (2002).
For the first time, spatially-resolved maps of blue-shifts in coronal lines during the decaying phase of a small flare are presented. These blue-shifts were located at the two ends of a small loop system and can be interpreted as indirect evidence of chromospheric evaporation. Fe XIX emission showed some interesting properties, including a pre-flare enhancement along the loop structure.
|
 |
 |
 |
Giulio Del Zanna |
CDS observations of flares |
UNIVERSITY OF CAMBRIDGE Department of Applied Mathematics and Theoretical Physics |
|
2 of 10 |