% mp -l 2 -t 'plot %d' eye0layer0 eye0layer3 'sin(x)' 'cos(x)'
This will create the script mpout which can then be loaded into gnuplot:
% gnuplot
gnuplot> load 'mpout'
gnuplot> quit
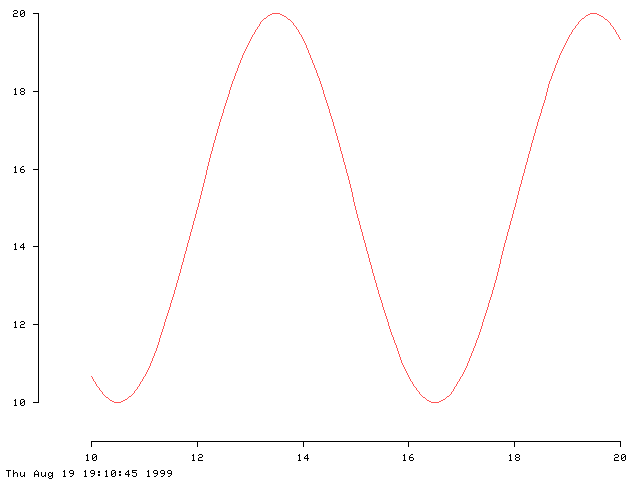
Which produces the following output: (gif) or (postscript). Postscript file was generated with another small script and then converted to a gif using xv.
To achieve this kind of plot, use the `arrow' commands to draw the axes rather than `border'. The example plot above was created by this file.
Here is a slightly longer example: gnuplot file and postscript output.
Gnuplot FAQ and a new beta document.
Gnuplot beta mailing list.
Beta downloads site gplot is a script that allows you to call gnuplot from the shell command line, rather than interactively.
xgfe is a graphical front-end to gnuplot.
Run gnuplot over the web using this interface.
Post-process bar charts so they are filled in different colours.
Colour map surfaces. This site also provides a mouseable mode for OS/2 terminal.