Figure 2: One XMM/OM optical image (large FOV) of the target.
The two stars are in the centre of the FOV.
Below are two sample images from the fast-mode extraction
windows.
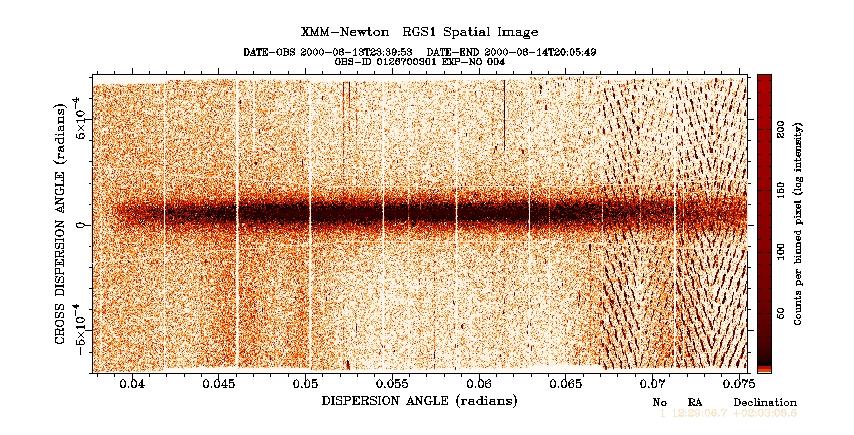
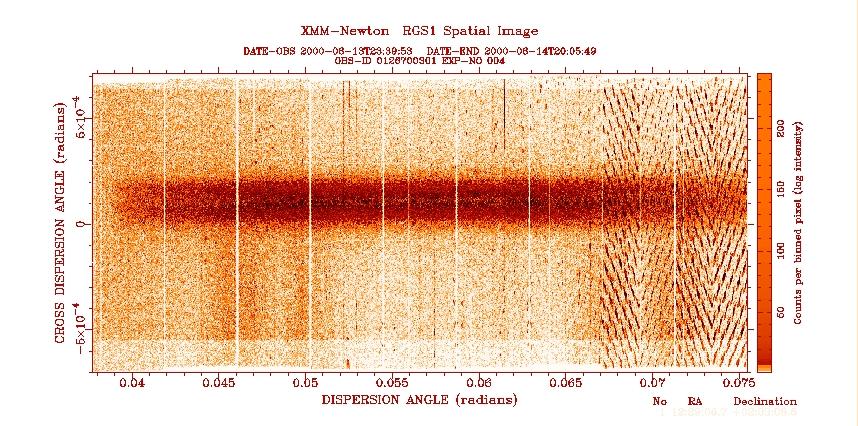
Figure 3: XMM/RGS spectra.
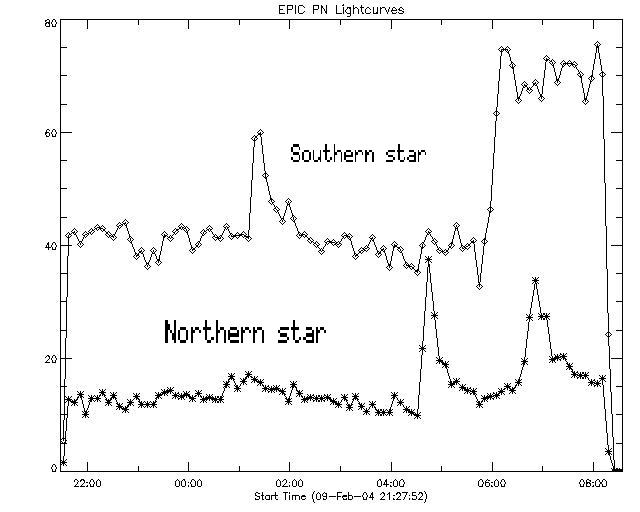
Figure 4: XMM/EPIC count rates for the two stars. [courtesy of Carl Foley]
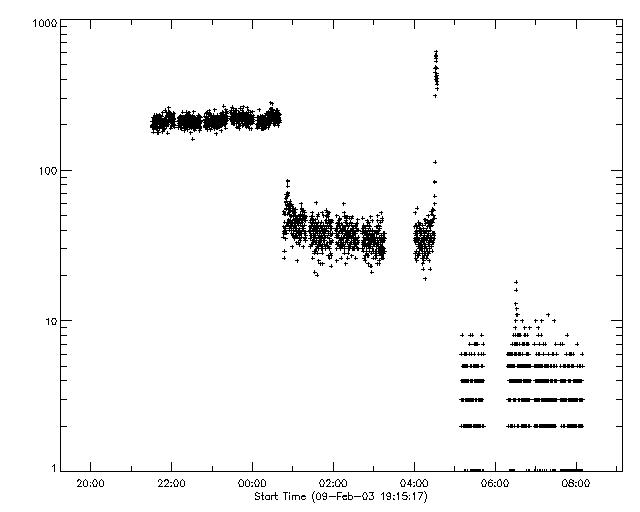
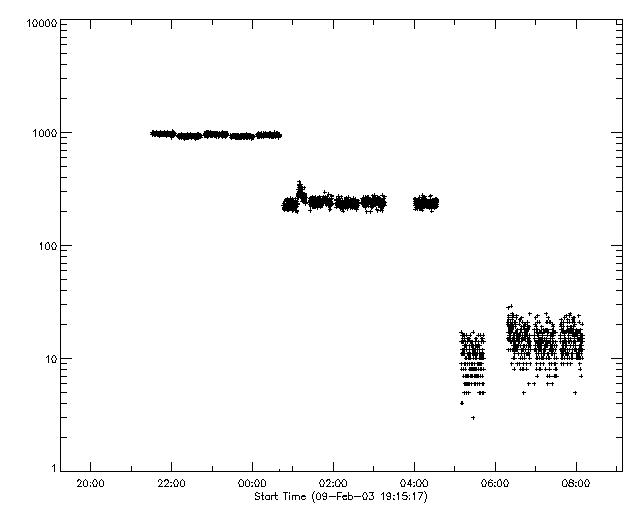
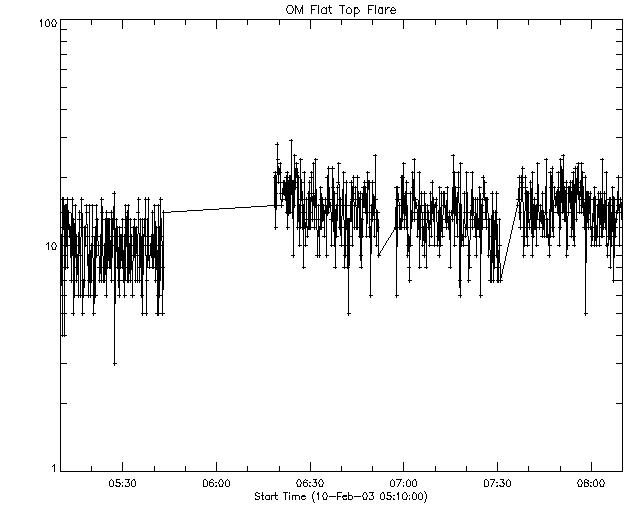
Figure 5: XMM/OM count rates for the Northern (upper plot)
and Southern (lower plot) stars [courtesy of Carl Foley].
Note: the count rates in the different filters are different,
and have not been normalized. In this way, it is obvious to see
when the different filters have been switched.
Also note the many data are missing.
Figure 6: Zoom of the XMM/OM count rates
for the flares on the Northern (upper plot)
and Southern (lower plot) stars. [courtesy of Carl Foley]