A more direct determination of an isothermal electron temperature, that is not dependent on ionization equilibrium assumptions, can be obtained from the intensity ratio of two allowed transitions to the ground level g of the same ion, from upper levels j and k having significantly different excitation energies Egj and Egk [In general, ratios of allowed lines pertaining to different transition arrays are temperature sensitive].
In fact, if
|
the intensity ratio is temperature-dependent, and assuming that the lines are emitted by the same isothermal volume with the same electron density, an isothermal temperature can be directly deduced from the intensity ratio.
Being allowed, their transition probabilities Ajg , Akg are high, and the intensities are then proportional to the collisional rates : Ijg ~ hngj Ne Ng Cegj , Ikg ~ hnkg Ne Ng Cegk.
| (28) |
Such spectral lines are far apart in wavelength and are normally observed by different instruments. Simulataneous observations with different instruments are not common, and instrument calibrations are also difficult.
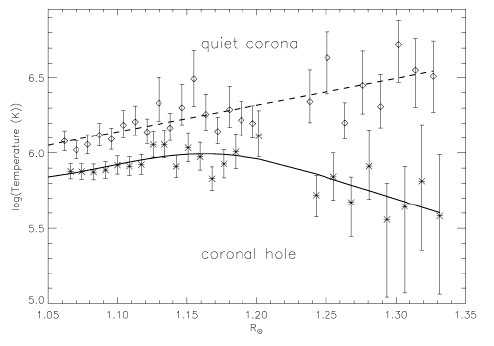
Good temperature diagnostics in EUV-UV spectral range are the ratios of O V [629/172], O V [1218/629], O VI [1032/173]. The latter was used by A.Gabriel and his group to provide one of the few direct measurements of the electron temperature in off-limb spectra of the quiet Sun and the coronal holes (David et al. 1997).
|

|
Within CHIANTI, TEMP_PLOTTER is a high-level widget for the analysis of temperature-sensitive ratios of lines from the same ion. It allows inclusion of proton rates and photoexcitation. The calling sequence is simple:
IDL > temp_plotter,'o_5'
As in the case of densities, a better and more global approach is to plot the ratios of the observed vs. theoretical line intensities for all the observed lines.
Giulio Del Zanna |
Spectral diagnostics in the EUV |
UNIVERSITY OF CAMBRIDGE Department of Applied Mathematics and Theoretical Physics |
|
23 of 28 |