Temperatures are commonly estimated by many authors from soft X-ray or EUV
broad-band filter images.
This method uses the intensity ratios of two or more filters in which emission
comes mainly from plasma at distinct temperatures for the respective
filters.
In general, these
filter ratio techniques should be avoided, if possible,
for a variety of reasons.
- Most passbands are multi-thermal, hence different spectral
lines can become dominant, depending on the source.
-
Lines that contribute to the emission
observed through one filter, will not normally
be formed at the same temperatures, and hence might not be emitted by the same
spatial regions: the filter does not then sample isothermal plasma.
The ratio with another filter image would therefore be meaningless.
-
Some atomic data for the entire band might be
missing or be uncertain.
-
there is an added uncertainty due to
the ionization fractions of the ions.
-
Filter ratio curves are often multi-valued.
-
Lines in a broad-band emission, might
derive from different elements (as is the case for the YOHKOH filters),
and therefore assumptions about element abundances have to be made, thus
increasing the uncertainty in what is already only an average temperature.
|
|
|

|
Figure 28: [from Del Zanna & Mason 2003]
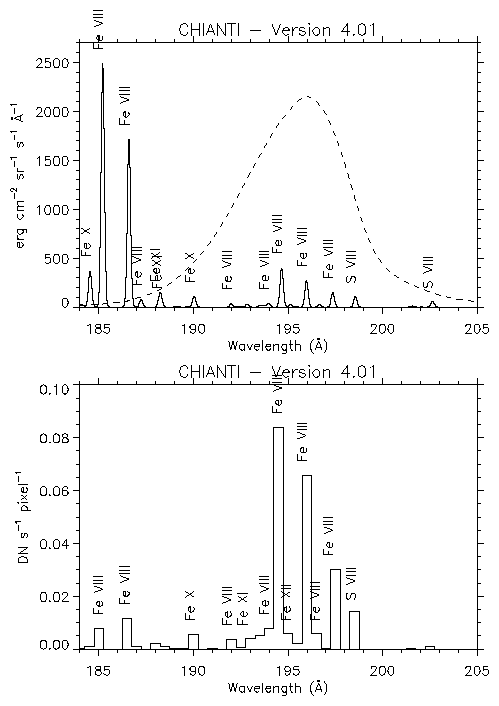
Top: simulated spectra for the region C
(background-subtracted) in the TRACE
173 Å and 195 bands (the TRACE effective areas, rescaled, are shown with a
dashed line).
Bottom: simulated spectra folded with the TRACE effective area.
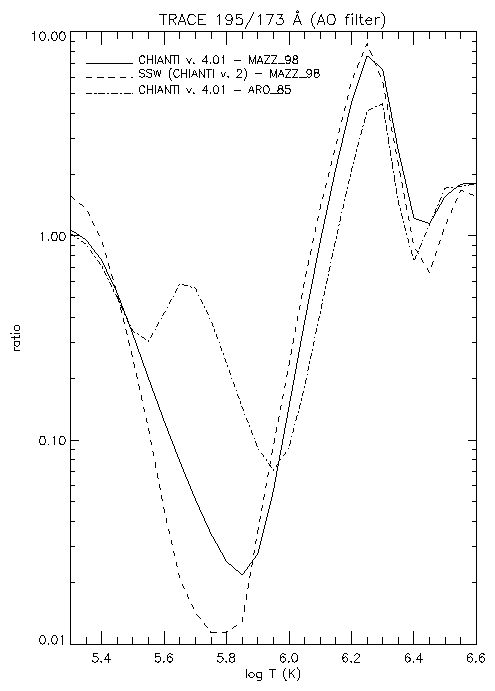
Figure 29: The TRACE responses and 195/173 Å ratio
Figure 30: [from Del Zanna & Mason 2003]
A comparison of various ionization equilibrium
calculations for Fe VIII and Fe IX.
In the particular case of TRACE, the following problems
have been present:
- No in-flight TRACE calibration.
-
Fe VIII emission can be the dominant contributor to the
195 Å passband.
-
Fe VIII emissivity are `missing' in the current
TRACE responses (CHIANTI v.2 was used).
-
there is an added uncertainty due to
the ionization fractions of
Fe VII-IX and the other ions.
-
Fe VIII is anomalous
-
The filter ratio curve is multi-valued.
Similar problems have been found for the EIT.
Figure 31: [from Del Zanna et al. 2003]
Top:
GIS 1 spectra of plume, coronal hole and quiet sun.
Bottom: same as above, but multiplied by the EIT 171 Å filter response.
The EIT is dominated by Fe IX and Fe X lines, while the Fe VIII lines,
very strong in the plume, are not observed by the EIT filter.
Note, however, that
any small error in the EIT passband can have a considerable effect.
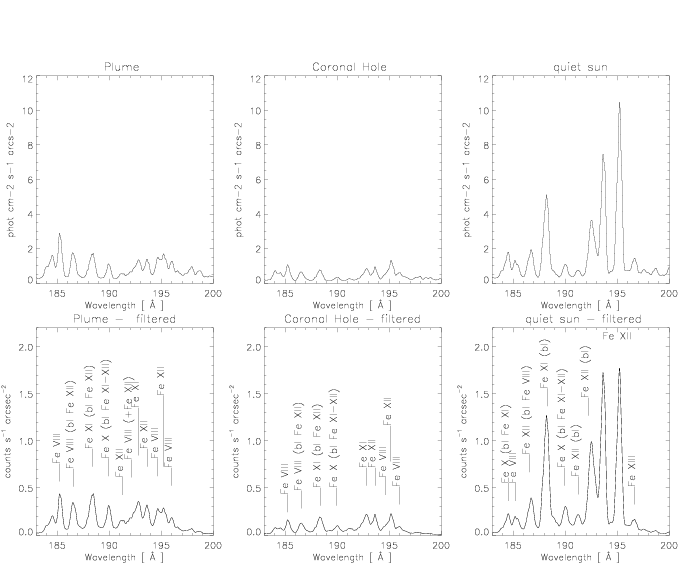
Figure 32: [from Del Zanna et al. 2003]
Top: GIS 1 spectra of plume, coronal hole and quiet sun.
Bottom: same as above, but multiplied by the EIT 195 Å filter response.
Note that while in the quiet Sun the EIT signal is dominated
by Fe XII lines, in the coronal hole lower temperature lines become
significant. In the plume, the signal is dominated by Fe VIII lines.
The 195 Å filter is therefore not isothermal.


