Be aware that large differences between different tabulations (e.g. Arnaud & Raymond, 1992; Arnaud & Rothenflug, 1985; Mazzotta et al., 1998) are present, and that large uncertainties are associated with these calculations.
|
It should be noted that the ionisation equilibrium plays a major role not only in the derivation of the DEM, but also in that one of the elemental abundances.
|
 |
 |
It is important to be aware of the fact that a number of ions, in particular those of the Li and Na isoelectronic sequence, present anomalous behaviour (see Del Zanna et al., 2002, and references therein for details).
This anomalous behaviour of the ions of the Li and Na isoelectronic sequences has been known for over thirty years in solar physics, but has been largely neglected in the literature.
Del Zanna et al. (2001) have reanalysed Skylab data using the Mazzotta et al. (1998) ionisation fractions and up-to-date atomic data to show the extent of this anomalous behavior. The results are that lines of the Li-like N V and C IV are underestimated by factors of 3 and 10, while those of Ne VIII and Mg X are overestimated by factors of 5 and 10, respectively.
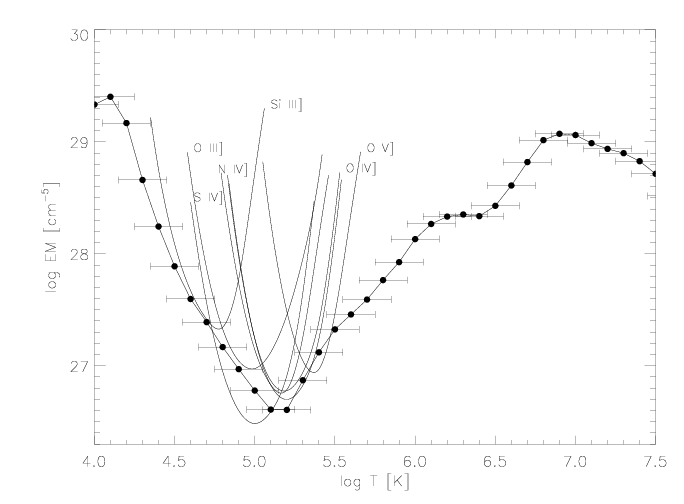
Del Zanna et al. (2002) have shown for the first time that this anomalous behaviour also occur in stellar transition regions (see Fig. 16). As a consequence, erroneous results in all previous literature were obtained for: a) the DEM or emission measures; b) the elemental abundances; c) the densities using the emission measure loci method; d) the radiative losses.
Giulio Del Zanna |
Spectral diagnostics in the EUV |
UNIVERSITY OF CAMBRIDGE Department of Applied Mathematics and Theoretical Physics |
|
13 of 28 |