For example, absorption via photoionisation by
overlying cool neutral hydrogen and helium (neutral
or firstly ionised).
This is very common, in particular when prominences
are observed, and in TRACE images.
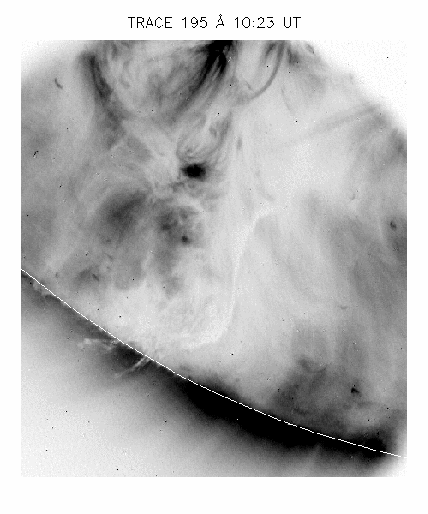
Figure 11: [from Del Zanna et al. (2004)]
Ha image, TRACE
195 Å image (negative) of a filament observed on May 9 1998.
Note the strong depression in the coronal lines
observed in the TRACE 195 Å band.
A background intensity Ibg becomes absorbed
Given normal abundances, the
absorption due to neutral oxygen and carbon is in fact negligible,
and therefore
at l > 912 Å practically no absorption is present.
At l < 912 Å we have:
|
t = sH I |
ó
õ
|
NH I dl + sHe I |
ó
õ
|
NHe I dl+ sHe II |
ó
õ
|
NHe II dl |
| (4) |
where:
sH I,
sHe I,
sHe II
are the photoionization cross
sections for the neutral hydrogen, neutral helium and singly-ionised helium;
N
H I, N
He I, N
He II are the respective number densities.
Figure 12: [from Andretta et al. (2003)]
Photoionisation cross sections for
He I (dot-dashes),
He II (solid) and H (dashes),
per hydrogen atom. In the inset,
these cross sections are compared on a wider wavelength range to XUV
photoabsorption by metals.
Vertical lines at the bottom of the
plot mark the wavelengths of the first resonance lines and of continuum edges
for He and H; the gray areas indicate the wavelength
coverage (first spectral order) of the two spectrometers of SOHO/CDS: Normal
Incidence, NIS (lighter gray), and Grazing Incidence, GIS (darker gray).
