|
|
Within CHIANTI, DENS_PLOTTER is a high-level widget for the analysis of density-sensitive ratios of lines from the same ion. It allows inclusion of proton rates and photoexcitation. The calling sequence is simple:
IDL > dens_plotter,'si_9'
|
|
| Ion | Ratio (Å) | Detector | log Tmax | log Ne | |
| Si IX (*) | 349.9 (3) / 341.949 | N 1 (G 4) | 6.02 | 7.5 - 9.5 | |
| Si IX | 345.100 / 341.949 | N 1 (G 4) | 6.02 | 7.5 - 9.5 | |
| Si IX | 349.9 (3) / 345.100 | N 1 (G 4) | 6.02 | 7.5 - 9.5 | |
| Si X | 356.0 (2) / 347.402 | N 1 (G 4) | 6.12 | 8.0 - 10.0 | |
| Fe XII | 338.278 (!) / 364.467 | N 1 (G 4) | 6.16 | 7.0 - 12.0 | |
| Fe XIII | 321.4 / 320.80 | N 1 | 6.21 | 8 - 10 | |
| Fe XIII | 318.12 / 320.80 | N 1 | 6.21 | 8 - 10 | |
| Fe XIII | 359.6 (2) (!) / 348.18 | N 1 (G 4) | 6.21 | 8 - 10 | |
| Fe XIII (*) | 320.8 (bl) / 348.18 | N 1 | 6.21 | 8 - 10 | |
| Fe XIII (*) | 203.8 (2) / 202.044 | G 1 | 6.21 | 8.5 - 10.5 | |
| Fe XIV | 353.83 / 334.17 | N 1 (G 4) | 6.25 | 9.0 - 11.0 |
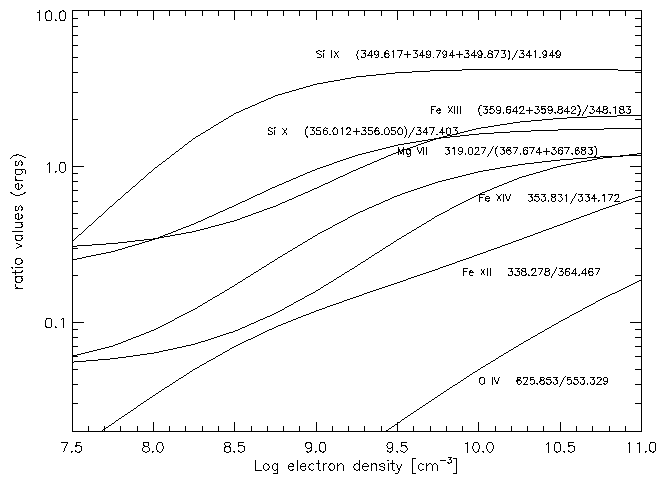
Table 2 presents a list of useful density-sensitive line ratios available within the CDS channels.
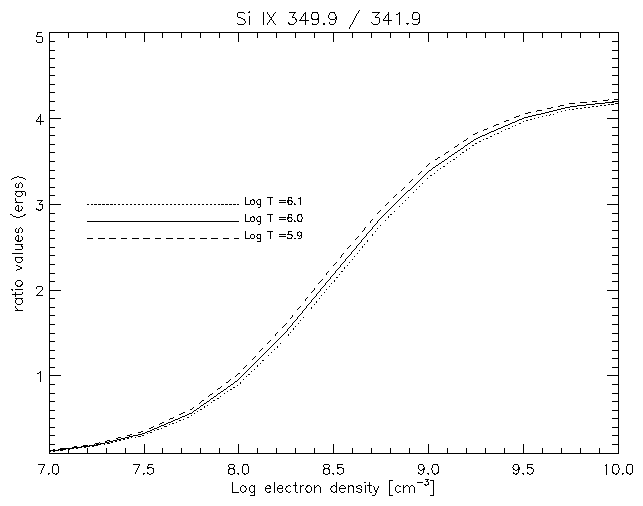
Figure 19 shows the density-sensitive Si IX ratio calculated at three temperatures (T=106 K is the temperature of maximum ionization fraction for Si IX), showing that these temperature variations do not appreciably affect the ratio.
The radiation that comes from the solar photosphere can excite transitions between levels in the ground configuration of ions in the corona, mainly affecting the level balance calculations for low densities (Ne £ 108 cm-3).
The effect is stronger close to the photosphere, and tends to die out with height because of the decrease of the photospheric radiation field with distance. This decrease can be accounted for by estimating a geometric dilution factor that is a function of height above the photosphere. Si IX should be affected more than other ions.
Spectral diagnostics in the EUV |
UNIVERSITY OF CAMBRIDGE Department of Applied Mathematics and Theoretical Physics |
|
19 of 28 |