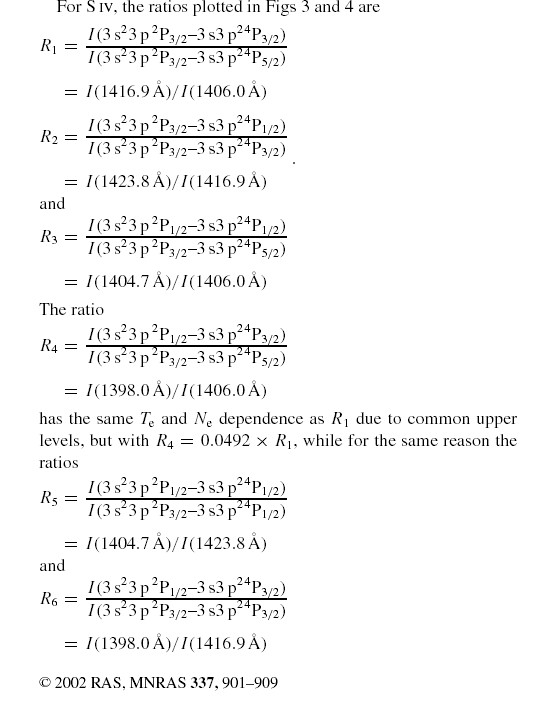
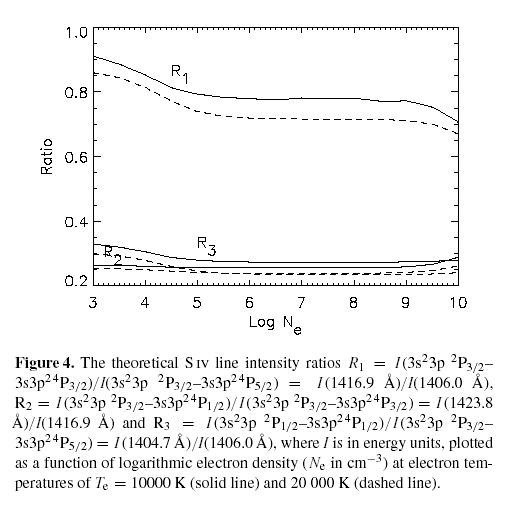
It is common in the literature to use only a few well-behaved line ratios, without considering all the observed lines.
|


|
Or consider a large number of ratios. The fact that with many lines a large number of line ratio combinations is possible, and the large number of ratios sometimes complicates the interpretation.
A different approach, preferable when more than two lines from an ion are observed, is to plot the values of
| (26) |
as a function of electron density, calculated at a fixed temperature. All the curves should cross at one point, if the plasma is isodensity. The Fji curves should be calculated at the effective temperature, i.e. at the temperature where the bulk of the ion emission is (see Del Zanna et al. 2002 and Del Zanna et al 2004).
|
In some cases, as for ions of the Be-like sequence, the method is very sensitive to the temperature, as Fig. 23 shows.
|
Giulio Del Zanna |
Spectral diagnostics in the EUV |
UNIVERSITY OF CAMBRIDGE Department of Applied Mathematics and Theoretical Physics |
|
20 of 28 |