|
|
Figures from Del Zanna et al. (2001) and my WWW pages.
|
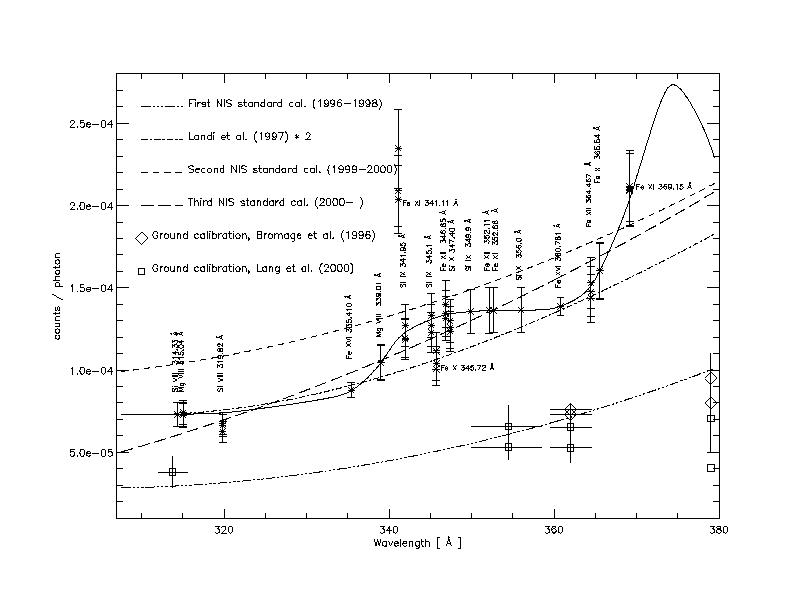
Excellent agreement is found between the calibration presented here and the other two independent in-flight studies based on rocket flights in 1997. In particular, the values of the calibration presented here almost coincide at 368 Å with the only reliable absolute NIS 1 measurement of Brekke et al. (2000). Significant discrepancies with the ground measurements are found.
|
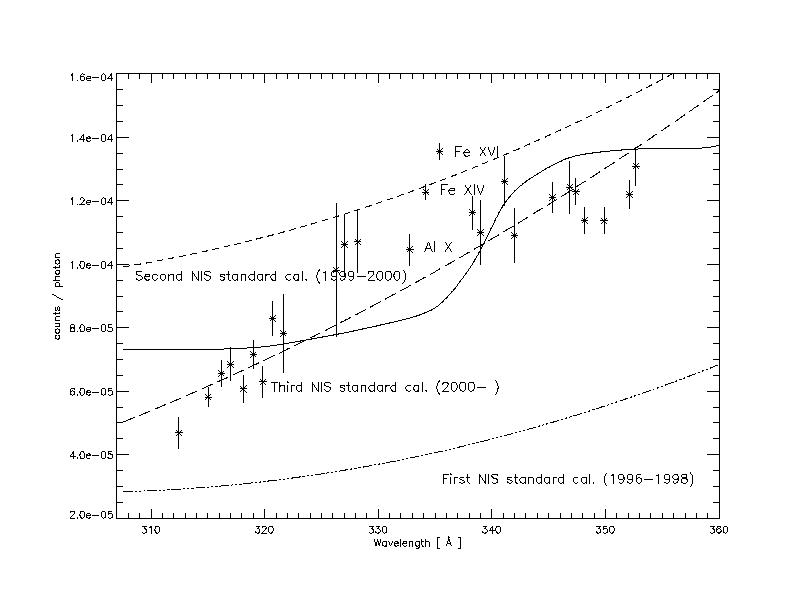
Very good agreement with the calibration proposed here is found, in particular at 320 Å and in the region 339-353 Å. The main disagreement concerns the lines that have been labelled, AL X 332.8 Å, Fe XIV 334.2 Å, and Fe XVI 335.4 Å. The CDS and SERTS-97 observed a very bright active region, and these lines were the most prominent ones in the SERTS-97 spectrum (indeed the measurement error is very small). The observations were made at a location with steep spatial gradients in the hottest lines, and any small spatial misalignment between the two instruments would mostly affect these three lines, that are the higher temperature lines in the SERTS-97 spectrum (R.J. Thomas, 2001, priv. comm. - further work is in progress).
|
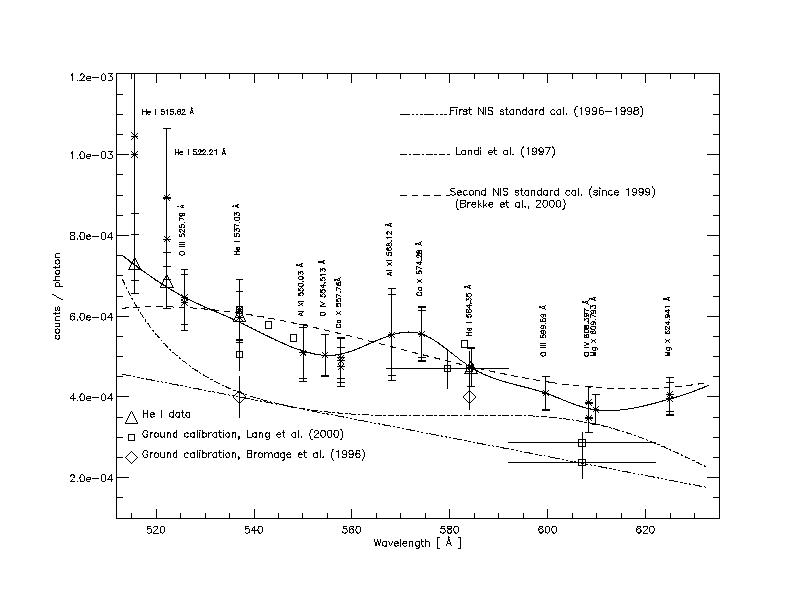
The only direct in-flight absolute calibration study is that of Brekke et al. (2000). In considering a detailed comparison with the diagnostic study presented here, it should be noted that the coarse resolution ( @ 5 Å) of the rocket flight spectrum limited the evaluation of the instrumental background, increasing the uncertainty. The spectra have been binned into six wavelength regions, and the background estimation was very difficult.
The downturn at wavelengths below 530 Å is regarded as uncertain by Brekke et al. (2000), because of low signal. The region 590-610 Å proved difficult to fit and was not used by Brekke et al. (2000). Considering the above, these results and Brekke et al. (2000) ones are very much consistent.
Note that neither the ground calibration measurements nor the theoretical predictions of the sensitivities are in accordance with both the direct in-flight results of Brekke et al. (2000) and those presented here. In particular, there is no agreement with the He I lines.
Finally, it is interesting to note that the calibration proposed here would partly explain the discrepancies that were found when the SUMER detector A and the NIS calibrations were compared in-flight at 584, 610, 625 Å (see Pauluhn et al., 1999).
|
CDS data analysis + spectroscopy using CHIANTI - MEDOC 2003 |
UNIVERSITY OF CAMBRIDGE Department of Applied Mathematics and Theoretical Physics |
|
26 of 41 |