5.1
Post-recovery
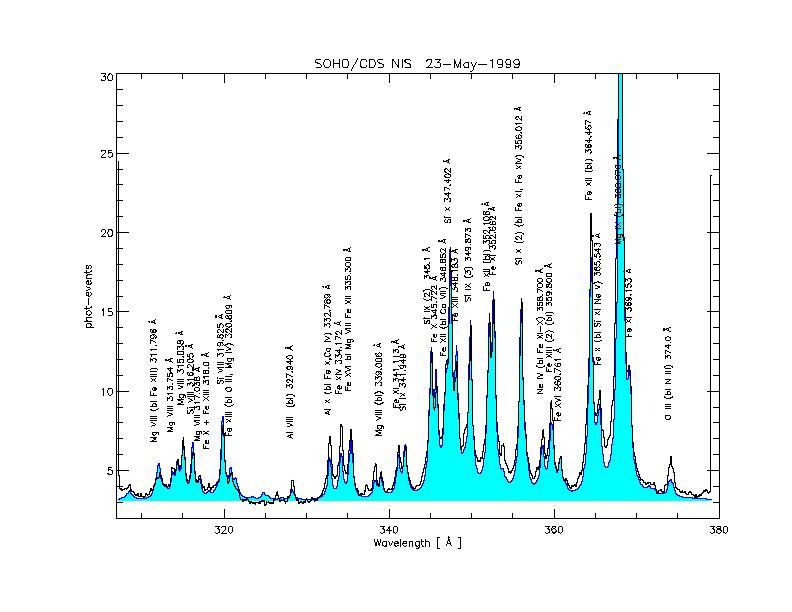
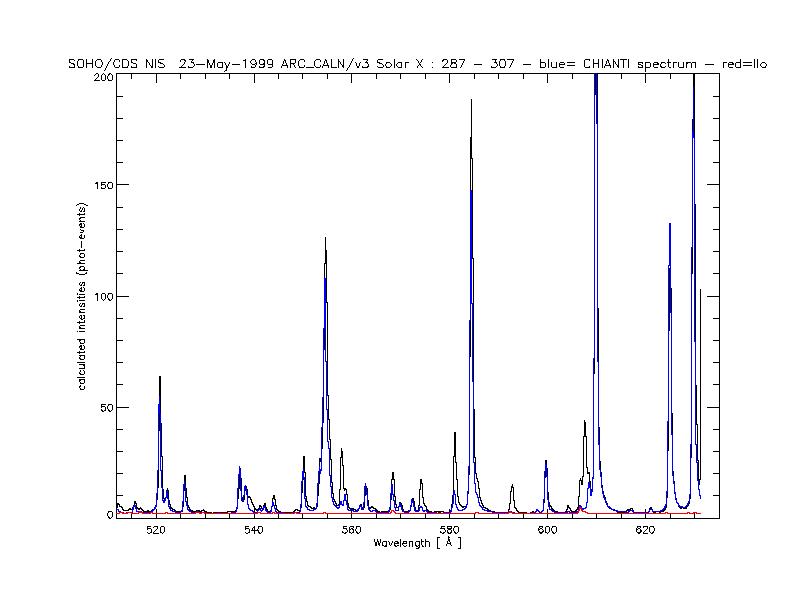
Figure 37: NIS post-recovery spectra.
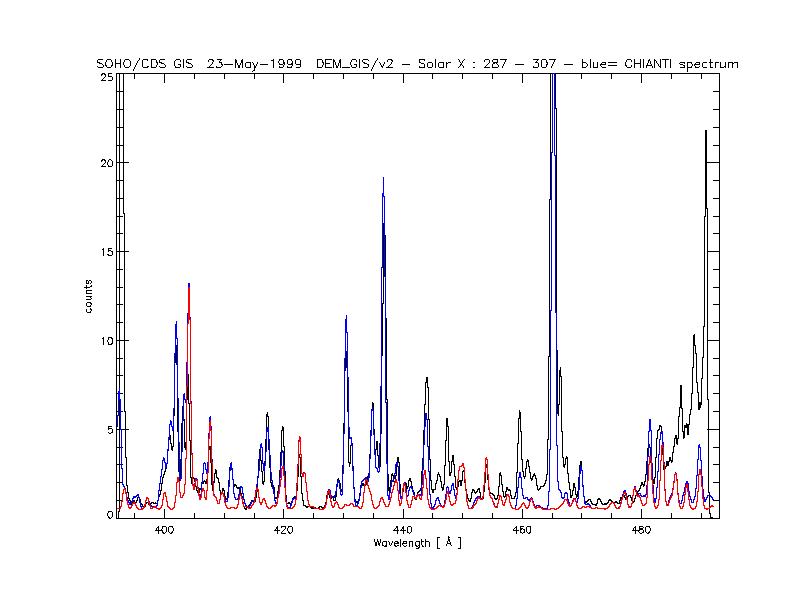
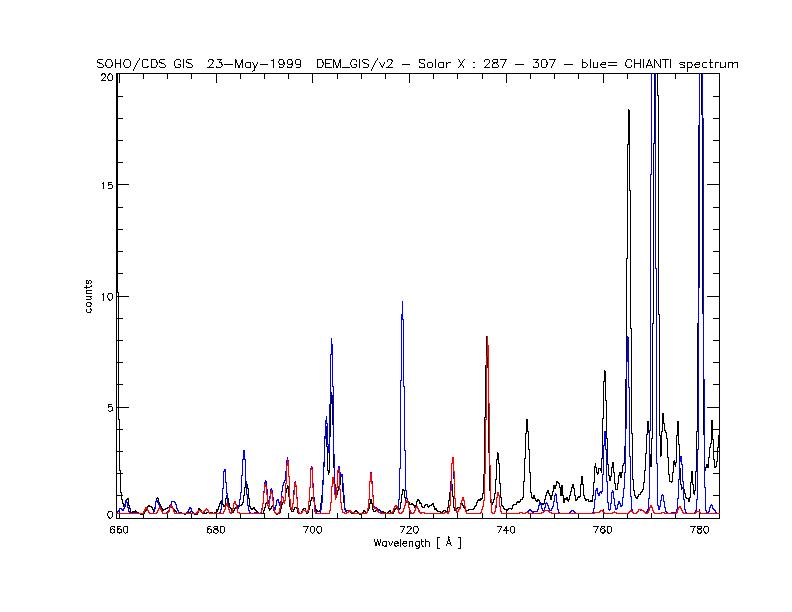
Figure 38: GIS post-recovery spectra. No obvious change in the calibration seems necessary. The GIS spectra are as good as those before SOHO loss !!!
Figure 39: GIS post-recovery spectra.
Giulio Del Zanna
CDS data analysis + spectroscopy using CHIANTI - MEDOC 2003
UNIVERSITY OF CAMBRIDGE
Department of Applied Mathematics
and Theoretical Physics
33 of 41