9.4  The EM approximations


Ith = Ab(Z)  
ó
õ
T 
 C(T, Ne)  Ne NH  dh

dT
dT
(21)

Many authors (e.g. Pottasch 1963; Jordan and Wilson 1971) approximate the above expression by removing an averaged value of C(T) from the integral:


Ith = Ab(Z)   < C(T) >  
ó
õ
h 
 Ne NH dh
(22)

A suitably defined volume line emission measure EML can therefore be defined, for each observed line of intensity Iob:


EML º  Iob

Ab(Z)   < C(T) >
     [cm-5]
(23)

The relative abundances of the elements are derived in order to have all the line emission measures of the various ions lie along a common smooth curve.

9.4.1  A different approach. The DEML method

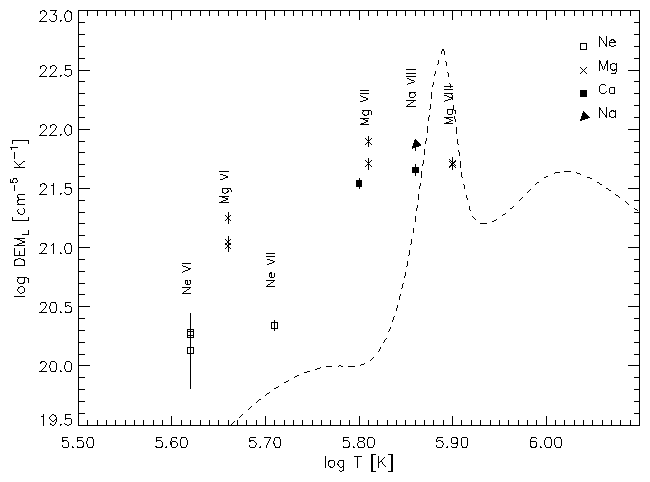
A different approach was proposed by Widing and Feldman (1989):

extract from the integral an averaged value of the DEM of the line, that here is termed the line DEM DEML:


DEML º < Ne NH  dh

dT
>     [cm-5 K-1]
(24)
such that for each line of observed intensity Iob:
DEML º   Iob

Ab(Z)  
ó
õ
T 
 C(T) dT
(25)
A plot of the Ab(Z)   DEML = Iob / òT  C(T) dT values displayed at the temperatures Tmax is used to deduce relative element abundances, adjusting them in order to have a continuous sequence of the Ab(Z)   DEML values.

9.4.2  Various problems

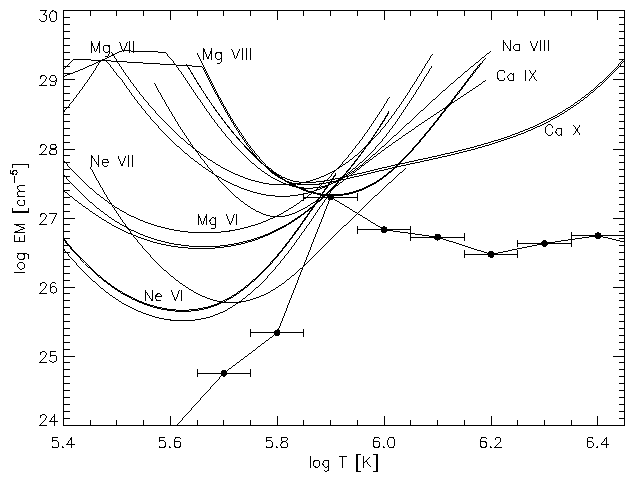
Only when the two lines have similar C(T) and the DEM distribution is relatively flat would one expect that the DEM factors out from the integrals:


ó
õ
T 
  C1(T, Ne)  DEM (T)  dT


ó
õ
T 
  C2(T, Ne)  DEM (T)  dT
=

ó
õ
T 
  C1(T, Ne)  dT


ó
õ
T 
  C2(T, Ne)  dT
(26)
If the above equality holds, then it is possible to deduce the relative abundances directly from the observed intensities and the contribution functions, because:
 Ab(X1)

Ab(X2)
=
I1 · 
ó
õ
T 
  C2(T, Ne)  dT

I2 · 
ó
õ
T 
  C2(T, Ne)  dT
=  DEML(X2)

DEML(X1)
(27)
i.e. the DEM method and the DEML method are equivalent.

However, this is not always the case. The Figures below show that, in the case of the famous Skylab plume observation of Widing and Feldman (1992), the DEML approximation overestimated the FIP effect by a factor of 10.

H3924f1.png

Figure 45: [from Del Zanna et al. 2003] The DEML values for the Skylab plume. The Ne and Mg values indicate the need to modify the adopted Ne/Mg photospheric abundance ratio, in order to obtain a smooth distribution of DEML values. The DEM(T) derived from the same data is plotted for comparison (dashed line).

H3924f2.png

Figure 46: [from Del Zanna et al. 2003] The Iob / (Ab * C(T)) curves for the Skylab plume, assuming photospheric abundances. The data indicate an isothermal distribution at log T=5.9 and are consistent with no FIP effect present. The emission measure EM(0.1) values (see Del Zanna et al., 2002 for the definition), calculated with the DEM of Fig. 46 and a Dlog T=0.1 are also shown (filled circles).

Many other effects can significantly affect results. For example:

- Blending

- Density effects

- The problem with the Na- and Li-like ions

See the many Del Zanna (et al.) papers...


File translated from TEX by TTH, version 3.08.
On 31 Oct 2003, 13:56.