|
|
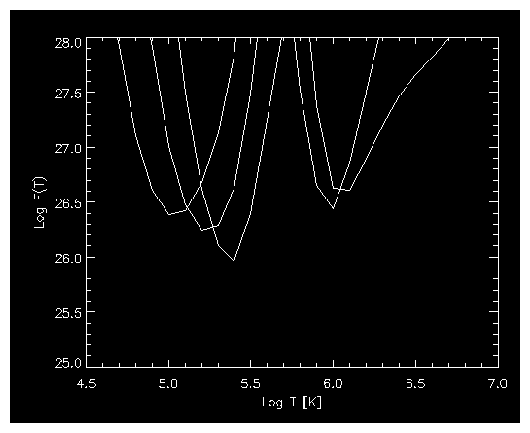
One direct approach is to plot the ratio Iob / G(T) for each line as a function of temperature and consider the loci of these curves to constrain the shape of the emission measure distribution. In fact, for each line and temperature Ti the value Iob / G(Ti) represents an upper limit to the value of the line emission measure EML (Equation 23, below) at that temperature, assuming that all the observed emission Iob is produced by plasma at temperature Ti.
Obtain the G(T) functions from the CHIANTI software, e.g.
gofnt, 'o_5', 580, 635, t_o_5, g_o_5,  d_o_5, $
press=1e15, abund_name=!xuvtop+'/abundance/sun_coronal.abund', $
ioneq_name=!xuvtop+'/ioneq/mazzotta_etal.ioneq'


; [default units are erg cm^+3 s^-1 sr-1 ]

; Suppose you have an O V 630 A intensity of 1812 [erg cm^-23 s^-1 sr-1]:


F_o_5= 1812./g_o_5

plot, alog10(t_o_5), alog10(F_o_5),$
 xr=[4.5, 7.], yr=[25, 28], /yst, /xst, $
 xtit='Log T [K]',  ytit='Log F(T) [cm-5]', chars=1.3
|
CDS data analysis + spectroscopy using CHIANTI - MEDOC 2003 |
UNIVERSITY OF CAMBRIDGE Department of Applied Mathematics and Theoretical Physics |
|
40 of 41 |