M.E.McIntyre
Centre for Atmospheric Science at the
Department of Applied Mathematics and Theoretical Physics
University of Cambridge
Article appearing on pp. 105-118 of Proc. Inst. Maths. Applics. symposium on Wind over Waves II: Forecasting and Fundamentals of Applications, edited by S. G. Sajjadi and J. C. R. Hunt. Horwood Publishing (Chichester, UK) and Inst. Maths. Applics. (Southend-on-Sea, UK), 2003, 232pp. Symposium held at Cambridge, UK, 3-5 September 2001.
The complete article it finally appeared can be downloaded as an acrobat (.pdf) file (0.7 Mb) from here, as an uncompressed postscript (.ps) file (3 Mb) from here, or as a gzipped postscript (.ps.gz) file (0.6 Mb) from here.

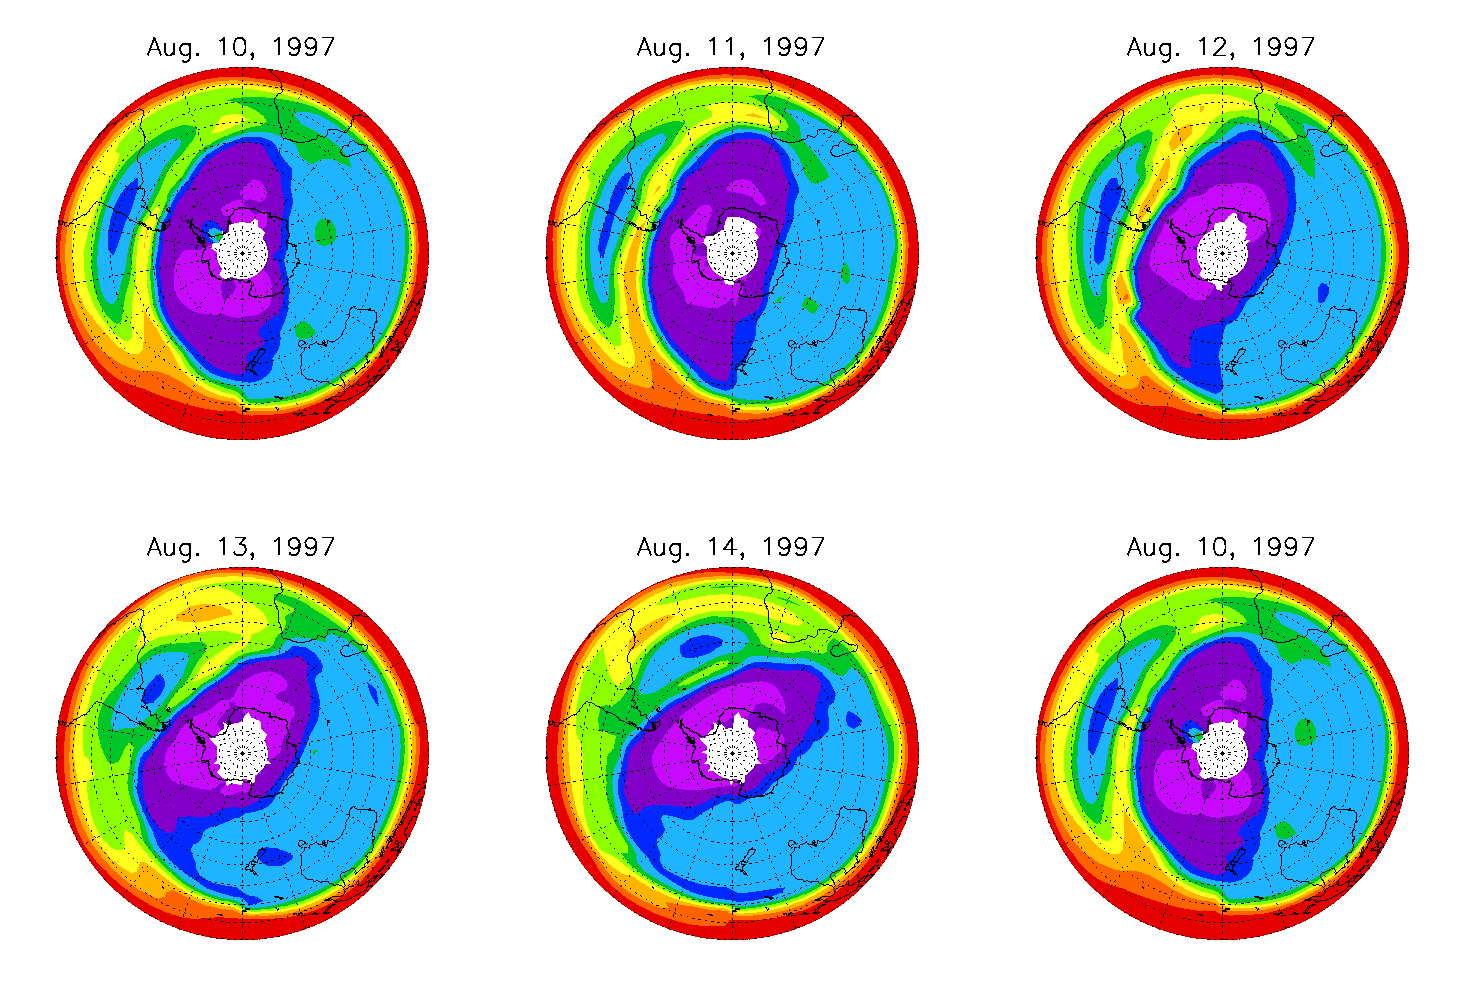
The above is an animated version of Figure 1b of the article, appearing at centre right on page 107 of the published version*. It displays CRISTA data, by kind courtesy of Dr Martin Riese of the research group at Wuppertal that developed the CRISTA instrument under the leadership of Professor Dirk Offermann. The image is from a paper to appear in a special issue of J. Geophys. Res. in 2002, entitled `Stratospheric transport by planetary wave mixing as observed during CRISTA-2'. To re-animate it (necessary on some browsers), use the browser's reload button. The image shows nitrous oxide mixing ratios in the southern-hemispheric wintertime upper stratosphere over several days, at a pressure-altitude 10 hPa, about 30 km. Nitrous oxide mixing ratios exhibit a large pole-to-equator gradient, yet provide an almost perfect passive tracer on timescales of days and weeks, characteristic of stratospheric Rossby waves and Rossby-wave breaking. Thus one can see the almost perfect mixing in large parts of the midlatitude `surf zone' (light blue area) and the steep gradients concentrated at its edges, indicating the reality of the inhomogeneous winter-stratospheric `wave-turbulence jigsaw puzzle', in which both waves and turbulence have essential roles. There is a closely analogous statement about wind-generated water waves.
Back to my home page ---- back to Atmospheric Dynamics home page