GWRA – Residents accounts of October 2001 flooding including depths and times of flooding.
Clare Hall – Information provided about flooding to College building and property.
Robinson College – No flooding of property reported, only flooding to grounds. Construction of Brick wall believed to prevent floodwater from entering College restaurant.
St Johns College – Limited flooding and damage to property but extensive flooding to grounds reported.
3.5 Other investigations
An approach was made to the Highways Agency to determine the drainage arrangements in place for the M11 motorway, in particular as to whether balancing ponds are incorporated to reduce flows downstream. No information had been obtained by the completion of this report.
3.6 Digital Terrain Model (DTM)
The DTM developed of the study area provides a flexible means of determining relatively accurate elevations throughout the study area, being based on a 2m grid spacing measured using laser technology operated from aircraft (LiDAR). This data is available downstream from just east of Laundry Farm on Barton Road. Floodplain level data have been extracted from the DTM for input to the ISIS model. The predicted flood levels have then been superimposed on the DTM to define flood limits for specific events.
The accuracy of the LiDAR data is generally considered to be of the order of ±0.20m. However, this accuracy is not always achieved and the data should be used with some care, with levels at vital locations checked against ground survey. A comparison of levels produced from the LiDAR data against the cross-section data generally indicates good agreement. However further and extensive ground level survey would be needed if greater accuracy of flood outline were required.
3.7 Utility Services Data
No service information has been sought.
4 Hydraulic Model Development
4.1 The ISIS Modelling Suite
Modelling studies were conducted using ISIS, the open channel hydraulic modelling software developed through a joint venture between Halcrow and HR Wallingford, and which is in widespread use throughout the UK water industry.
ISIS can be used to simulate varying flow conditions in open channel systems, and can incorporate many different hydraulic structures, including a variety of closed conduit types, weirs, sluice gates, bridges, pumps and reservoirs. It can include boundary units in the form of specified flows, hydrological units, rating curves, tidal boundaries or specified water levels.
4.2 Selection of Model Boundaries
The boundaries, or physical extents, of the hydraulic model have been located beyond the main area of interest at points where sensible boundary conditions can be estimated from available data. These locations are ideally beyond where the imposed conditions will have a significant effect in the study area, this assumption being confirmed by sensitivity tests.
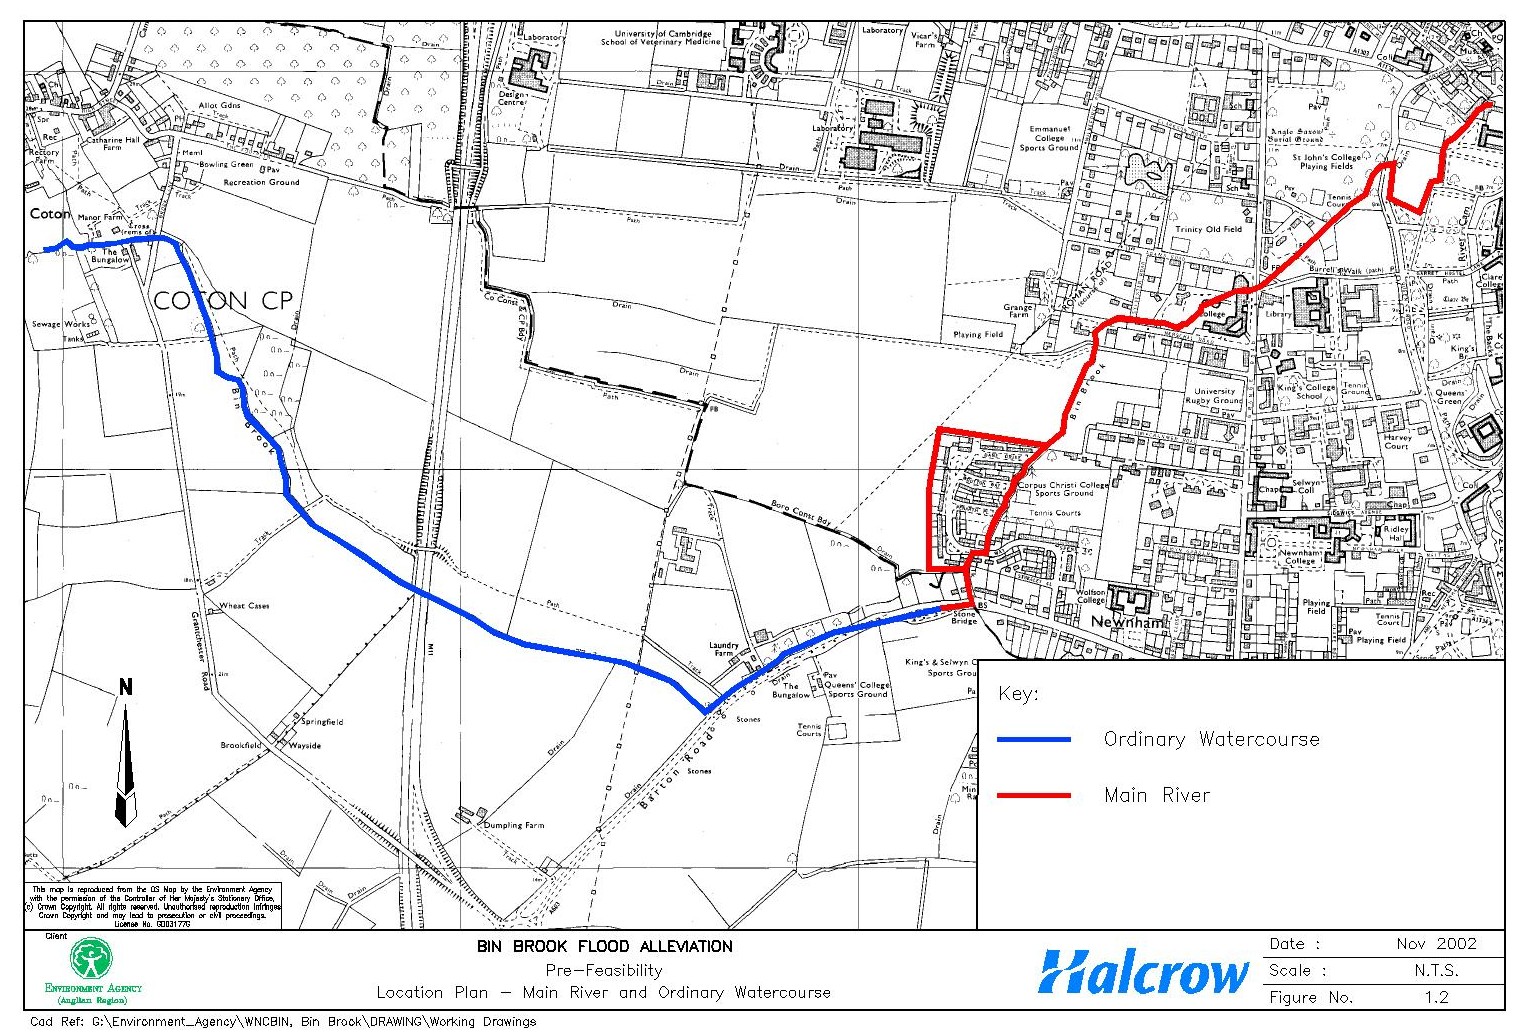
Taking account of both hydrological (see Section 5) and hydraulic factors, the Bin Brook channel has been modelled from its confluence with the River Cam up to Coton as indicated in Figure 1.2. A number of lateral inflow points are allowed for (Section 5) representing the tributaries, though the drain joining at Barton Road from the Fulbrooke Road direction has been incorporated separately as a storage area connected to the Bin Brook by the culvert beneath the road.
4.3 Development of Hydraulic Model
In developing the full out-of-bank model, where necessary the surveyed cross-section data has been extended over the floodplain using LiDAR data in areas where this is available (Section 3.6). Bank top spill levels have been taken from a combination of these two main data sources. Flood storage area data (i.e. stage/area curves) to represent areas of ponded floodwater have also been taken from the LiDAR data.
The schematisation of the floodplain areas as used to set up the initial ISIS hydraulic model has been reviewed during the calibration process (Section 6). The flood mechanism and model parameters have been adjusted to best reflect the calibration event records. The final model layout in the key areas of interest is illustrated in simplified form (i.e. river and culvert section location symbols turned off to aid clarity) in Figure 4.1. This shows the locations of structures in the model and indicates the overland flow paths allowed for in the assessment.
The key features of the flood mechanism can be summarised as follows.
The channel upstream of the M11 is steep (approximately 1 in 200 slope) and appears to have been enlarged and possibly regraded to ensure that it remains in-bank during high flows, thus not threatening the motorway. The M11 is not particularly raised across the brook alignment, with the culvert having adequate flood flow capacity.
Downstream from the M11 to Barton Road the channel slope is much flatter (approximately 1 in 400). High flows in the Bin Brook will start to utilise the left bank floodplain near Laundry Farm at flows of approximately 3.5m3/s (about 1 in 10 year event – see Section 7); the road level on the right bank is generally above flood level. Peak flood flows through the Barton Road culverts are limited to approximately 3.8m3/s. Significant flood flows will therefore bypass them by overtopping through the paddock on the left bank towards the mobile phone masts, and flow towards the Bin Brook diversion channel at the farm access road culvert on the south-west corner of Gough Way. Due to this natural channel overflow, predicted flood levels only just reach the level of Barton Road at the southern lay-by between the two culverts. Flows are significantly restricted at the access road to 114 Barton Road, until flows can spill across the top of the structure or into the gardens (about 1 in 10 year event).
The tributary entering the Bin Brook from the south backs up due to high water levels in the brook, and some additional head loss at Stone Bridge, to the Fulbrooke Road area.
The Gough Way culvert passes up to approximately 2.3m3/s (less than a 5 year design capacity), with any additional flow initially passing down the diversion channel cut to the west of the housing estate. This channel starts to take a share of the flow relatively early in the flood hydrograph. However, once the access track running along the upstream side of the estate is overtopped then flows pass into Gough Way down the footpath and through back gardens (about 1 in 40 year event). It is possible that water would start coming up through manhole covers and drains prior to this, although this local drainage has not been assessed.
Flood levels in the reach downstream from Gough Way are largely controlled by the restriction formed by the sluice structure at Robinson College, though this does not directly affect the flooding of Gough Way itself. The opening of the sluice gate, which is manually operated, only has a relatively minor influence on extreme flood levels (i.e. a wider structure would be required to increase capacity significantly). Bridge structures upstream from this sluice only have a relatively minor effect by comparison. Low-lying open areas at Clare Hall are likely to be flooded relatively frequently (at less than 1 in 5 year event), but only during extreme flood events will any flow be likely to pass down Herschel Road.
The bridge structure at Queens Road forms a significant restriction to flood flows, even allowing for the bypass culvert, and passes only up to 4.5m3/s (less than a 20 year design event). Flood levels therefore rise upstream, flooding large areas of St Johns’ playing fields, with significant flows having to pass over the road. The walls running along the downstream side of Queens Road, some relatively low, form the main control on this flow path.
Downstream from Queens Road there is significant interaction between the Bin Brook and River Cam flows. As discussed further in Section 4.4, this aspect has little bearing on the Bin Brook flooding and it has therefore not been represented in any great detail.
4.4 Modelling of Downstream Boundary
The Bin Brook model extends to a downstream boundary located at the confluence with the River Cam. At this point, water levels are controlled largely by weir and sluice structures a few hundred metres downstream at Jesus Green Lock.
Previous Studies of the River Cam (see Mott MacDonald report: River Cam Improvements Phase 2 Addendum 2 – Upstream of Byron’s Pool to Jesus Green Lock, Part 1, July 1999) indicate that the peak flood level at the confluence is limited to approximately 6.25m AOD (200 year event) by the opening of these control structures. A fixed stage boundary of 6.02m AOD, representing approximately 50 year Cam flood event, has been adopted; sensitivity testing indicates that flooding within the Bin Brook is not sensitive to the assumptions made here.
After the Bin Brook passes beneath Queens Road it turns parallel to the River Cam for about 400m, and flood levels in this reach are likely to largely reflect that in the River Cam. There is a lateral culvert (and side channel) connection between the two watercourses just after the Bin Brook re-enters the grounds of St Johns College on this reach, and over-bank flow across the intermediate lawns is also likely to occur. Peak flood levels on the Bin Brook upstream of Queens Road are almost entirely independent of the downstream boundary condition, the restricted openings here resulting in significant flows passing over the road at levels greater than 7.4m AOD.
4.5 Modelling of Inflow Boundaries
The inflow points to the Bin Brook model, forming the upstream boundary conditions, are discussed in Section 5.4. These inflow boundaries have been represented using the ISIS FEH unit (or flow time data based upon results from such units), which employs the latest rainfall/runoff method in the Flood Estimation Handbook.
5 Hydrological Analysis
5.1 General
The hydrological analysis has adopted the Flood Estimation Handbook (FEH) approach, incorporating both the statistical and rainfall/runoff methods. The objective has been to provide boundary inflow hydrographs for the hydraulic model for the calibration and design events. Output from the application of the FEH methodology for the analysis described below is included in Appendix D. Six inflow points have been identified as discussed further below.
5.2 Statistical method
The FEH statistical approach has been applied to the full Bin Brook catchment using the pooling group methodology to derive the flood growth curve fittings (see Appendix D. The catchment is ungauged and therefore Qmed has been calculated by using catchment descriptors extracted from the catchment database contained on the FEH-CDROM. This initial calculation of Qmed has then been adjusted using a data transfer procedure from three hydrologically similar donor catchments listed in Table 5.1. In this case, Qmed (median value from the annual maximum flow series) was increased from 2.7m3/s to 2.9m3/s and used to compute the statistical flood frequency curve (FFC).
Table 5.1 Catchment descriptors for Bin Brook catchment and three analogue catchments used to adjust final estimate of Qmed
|
|
Subject Catchment |
Analogue catchments |
||
|
FEH Catchment Descriptor |
Bin Brook @ Cam Confluence |
36009 Brett @ Cockfield |
36010 Bumpstead brook @ Broad Green |
30014 Pointon Lode @ Pointon |
|
AREA |
17.48 |
25.70 |
28.03 |
11.09 |
|
SAAR |
555 |
588 |
588 |
591 |
|
FARL |
0.99 |
1.00 |
1.00 |
1.00 |
|
SPRHOST |
50.6 |
44.6 |
44.6 |
42.0 |
|
BFIHOST |
0.352 |
0.387 |
0.387 |
0.340 |
5.3 Rainfall/runoff Method
A rainfall/runoff model of the full catchment area has also been set up to allow comparison of peak flood flow estimates generated from design rainfall data with those generated by using the statistical method. The rainfall/runoff method uses various hydrological parameters representing the catchment and a rainfall storm profile to compute runoff volumes and subsequently a flow hydrograph. For the October 2001 calibration event, daily data from the following rain gauges have been used to ascertain rainfall depths:
Boxworth
Cambridge
Botanic Gardens
Toft
Grantchester
Oakington
The 15 minute rainfall data from the Bourn auto-gauge has been used to determine the storm profile. Figure 5.1 shows the location of the above gauges in relation to the Bin Brook catchment. As indicated on the figure, all lie within a 10km radius of the catchment centroid.
The rainfall/runoff FFC is then compiled from peak flows at increasing return periods. Reconciliation between the flood frequency curves, derived from both statistical and rainfall/runoff methods, has been achieved by applying a scaling factor of 0.7 to the rainfall/runoff output hydrographs (see tabulation and plot in Appendix D). Evidence from the October 2001 event relating to the event flow hydrographs generated is reviewed in Section 6.
5.4 Sub-catchment Inflows
Boundary inflows into the model have been created using the FEHBDY units within ISIS, or a flow time (QTBDY) boundary in cases where the growth between two FEH calculation points has been required (i.e. where the subcatchment required can not be directly represented by catchment descriptors). These inflow points have been located at either tributary inflows or where it has been deemed hydraulically important for the ISIS model and any subsequent flood analysis. The six inflow points identified represent the upstream catchment to Coton, the additional catchment to the M11, two southern tributaries entering near Laundry Farm and from Fulbrooke Road and two northern tributaries entering near Clare Hall and through St Johns College playing fields. The total catchment area to the Cam confluence is allowed for within the analysis.
6 Model Calibration
6.1 General
Calibration modelling refers to the process of adjusting model parameters in order to improve the agreement between observed data and model results. The aim is to confirm the reliability of the model parameters and input data for both the hydrological and hydraulic model components. Ideally at least three events should be used for the full model calibration, but for the un-gauged Bin Brook catchment adequate data exists for only one event (Section 3) and so calibration has been carried out solely against the October 2001 event.
6.2 Calibration Data
The hydrological analyses carried out, for the production of inflow boundaries to the hydraulic model for the October 2001 event, are detailed in Section 5. The inflow hydrographs produced were reviewed as part of the calibration process as outlined in Section 6.3. Flood levels for the October 2001 event have been surveyed at key locations (Section 3), together with critical threshold levels.
6.3 Calibration Modelling Exercise
Calibration of the model against the October 2001 event has investigated both the hydrological and hydraulic data, as well as the validity of the observed data. No revision has been carried out to the calculated hydrological parameters (e.g. Tp and SPR). This is because a good match to recorded peak flood levels was obtained, with no resulting indication that flows should either be increased or reduced. The sensitivity of the calibration model results is discussed further in Section 6.4.
Observed and simulated peak flood levels for the October 2001 event have been compared at the available calibration points as summarised in Table 6.1 below (see Figure 4.1 for locations). The comparison can be summarised as follows.
Recorded peak flood levels are matched within 0.05m, apart from at 9 Clare Hall where the modelled level is 0.08m higher than that surveyed. These are well within survey and model tolerances. The mean difference is close to zero, indicating no overall trend above or below the recorded values.
The calibration model simulation recreates known flooding of the properties at Gough Way, Barton Road, Clare Hall (9 Herschel Road) and Robinson College, as shown by Table 6.1. A flood level recorded at 6 Penarth Place has been matched assuming that it is controlled by the left bank local topography, though this is uncertain without very detailed survey. Local information suggests that the flood level in the downstream brook reached the same height as in the property, the model indicating that this is only likely if significant blockage occurred at the footbridge a short distance downstream. Sudden clearance of such a blockage could also explain descriptions of the water levels here dropping very suddenly.
The calibration model simulation also recreates known flooding over Queens Road and of properties at Laundry Farm on Barton Road and Croftgate Flats on Fulbrooke Road, though these are not shown in Table 6.1 as there is no known flood depth. The flood level also reaches very close to the threshold of the Clare Hall property (No. 11) on the left bank, as indicated by residents during a site visit.

Based on the above, it is considered that an excellent model calibration has been achieved, as discussed further in Section 6.4, though only against a single event and with no direct measurement of flow. The peak flood inflows at the model boundaries for the calibration event are generally close to the 1 in 50 year design event inflows summarised in Section 7. However, the routed flows and peak flood levels at the key locations are close to those from a 1 in 100 year design event (Table 7.2), due to the duration and shape of the event hydrograph.
The predicted flood extent for the October 2001 event, based on the calibrated model results is shown in Figure 6.1.
6.4 Calibration Model Sensitivity
Flooding on the Bin Brook is very much controlled by key structures (e.g. Barton Road and Gough Way culverts and Robinson College sluice). Therefore in calibrating the model the channel roughness is a less significant concern than hydrological model inflows and structure capacity, including bypass flow paths around structures and the potential for blockage. Matching the event hydrology is only possible at present by comparison of recorded and simulated peak levels for a single event.
The October 2001 calibration event utilised is shown (Section 7) to lie between the 1 in 50 and 1 in 100 year events for the catchment, causing overtopping around structures and significant property inundation. In calibrating the hydraulic model therefore, care has been taken in schematising the bypass flows across the floodplain around structures such that a good fit to recorded flood levels can be taken as an indication of a reasonable match in terms of peak flood flows.
As noted above, the channel and floodplain roughness values adopted have only a relatively minor influence on the flooding produced, but have been adjusted as part of the calibration process. The reach having greatest influence on the calibration results is the Gough Way diversion channel, where a Manning’s ‘n’ value of 0.035 has been adopted for the concrete lined section. Values for ‘n’ of 0.05 and 0.06 have been adopted in general for earth channels and relatively open floodplain areas respectively. These are relatively conservative figures, and the structure coefficients adopted also represent some (though not major) loss of efficiency in terms of flow capacity. This may represent the effects of debris and blockage that occurred during the event, or may simply be allowing for aspects not fully represented in the model.
7 Design Event Modelling
7.1 General
The calibrated model discussed in Section 6 has been adapted to route design flood event inflow hydrographs through the modelled area in order to investigate the flood risk. Peak flood levels have been produced for a range of return periods between 5 and 200 years and these have been used to assess the present standard of protection and predict flood extents. Initial options for flood alleviation are outlined in Section 8.
7.2 Flood Flow Estimates
Based on the model calibration (Section 6), the adjusted FEH Rainfall-Runoff parameters for flood hydrograph estimation (Section 5) have been taken forward to define design event model inflows. A summary of design event modelled peak flood flows at key locations is shown in Table 7.1 below.
If additional flow/level data in the channel systems were collated, this could provide greater confidence in the modelling results, improving flood flow estimates as well as giving greater certainty over the performance of key structures.
7.3 Modelled Flood Levels
A summary of design event modelled peak flood levels at key locations is shown in Table 7.2 below, and selected design event profiles from Barton Road (near Laundry Farm) downstream are given in Figure 7.1a (Bin Brook) and 7.1b (diversion channel). The locations of key model nodes are shown in Figure 4.1. Aspects of the flood mechanism are outlined in Section 4.3 and are discussed further below.
7.4 Standard of Protection
The simulated design flood events outlined above indicate that the present standard of protection is approximately 10 years, at Laundry Farm, Barton Road and Clare Hall. Gough Way Estate and Croftgate Flats on Fulbrooke Road have a higher standard of protection of approximately 40 years, the diversion channel having improved this from a standard of less than 5 years at Gough Way previously. The predicted extent of flooding is discussed in Section 7.5 (Figure 7.2), and the thresholds of property flooding, depths of flooding and damages inflicted are outlined in Section 9.
7.5 Predicted Flood Outlines
Predicted flood outlines for 1 in 50 and 1 in 200 year flood events are shown in Figure 7.2. These flood outlines are based on interpretation of the peak flood level results obtained from the modelling exercise against the ground contours within the DTM (Section 3.6), together with other contour data from OS maps and ground survey drawings. The necessary simplification of some of the more complex flow paths within the ISIS model (e.g. through Gough Way) has also resulted in some interpretation of flood depths and extents being required.
The flood extents shown stop at the upstream limit of the LiDAR data available and have been plotted downstream to Robinson College sluice.
7.6 Sensitivity of Design Results
Flooding on the modelled watercourses is very much controlled by key points where flow capacity is restricted, as discussed in Section 6.4. The design event peak flood level results are most sensitive to changes in flow estimates and/or blockages at key structures. Increases in flow estimates of 20% (i.e. suggested climate change effect over next 50 years) would increase peak levels by up to over 0.1m at Gough Way (less at Barton Road), as indicated by the difference between the 1 in 100 and 1 in 200 year event results. As a result of such a change, the standard of protection to property in the study area would drop to below 5 years, with Gough Way protected to approximately a 20 year standard. This reduced protection level could be further significantly lowered by any major blockage of the key structures.
A 20% increase in the channel roughness Manning’s ‘n’ values, which were noted in Section 6 as having a relatively limited effect on flooding, would in most locations result in the 20 year event flood levels rising by up to 0.05m. However at Gough Way the resulting rise in floodwater is exacerbated by the restricted floodplain, giving increases of around 0.1m. This would still only reduce the estimated standard of protection here from 40 years to approximately 30 years.
A significant blockage (80-90%) of the Gough Way culvert would raise the 20 year peak flood levels upstream by approximately 0.4m, close to those predicted for the 100 year event. The standard of protection in this case would reduce to less than 5 years. It is therefore of crucial importance to maintain the culvert capacity, while maintenance of the channels is generally of slightly lower priority. The diversion channel is the most important watercourse to maintain on the Bin Brook, particularly the concrete section through high land to the west of Gough Way.
8 Flood Alleviation Options
8.1 Options Considered
A number of options are available for alleviating flooding. However, the options considered within this pre-feasibility report are as follows:
Option1 - Do Nothing
Option 2 – Maintain existing
Option 3 – Increase channel capacity
Option 4 - Flood Storage upstream
These have been considered in general terms in order to guide any further studies undertaken in developing such solutions.
8.2 Option 1 – Do Nothing
Under this option the current flood defences and watercourses are abandoned with no further expenditure incurred or work carried out.
8.3 Option 2 – Maintain existing
This option retains the status quo by carrying out the current level of maintenance and expenditure to maintain the current standard of service in flood defence terms.
8.4 Option 3 - Increase Channel Capacity
An improved flood defence standard of protection can be provided by increasing the capacity of the watercourse through the area of property affected. Gough Way is currently protected by the combined capacity of the Gough Way culvert and the relief channel. The enlargement of each has been considered on the basis of increasing the standard of protection to a 1 in 50 year event by carrying out works to enlarge either the channel or the culvert as described below. The resultant design peak flow downstream would be increased by 3%.
Option 3(a) - Relief Channel. This option would be achieved by increasing its width by 50%. For the concrete lined section this entails the demolition of the left bank wall, extending the base, and re-constructing the wall to a higher level to preclude the need for a greater land take. However, the earth channel would need to be widened with the consequent additional land acquisition. The access culvert in the southwest corner would also need to be rebuilt to a commensurate size.
Option 3(b) – Gough Way culvert. The necessary capacity could be achieved by the replacement of the culvert with a box section 2.4 m by 1.8 m along its entire length. The close proximity of property boundaries would result in significant disruption and disturbance.
As option 3(b) is more expensive than option 3(a) and provides an identical standard of defence, it is not considered further in the economic analysis.
The works described above would need to be supplemented with localised flood protection works to a small number of low-lying properties upstream and downstream, probably consisting of low embankments, to ensure the flood risk to them is not exacerbated.
8.5 Option 4 - Flood Storage
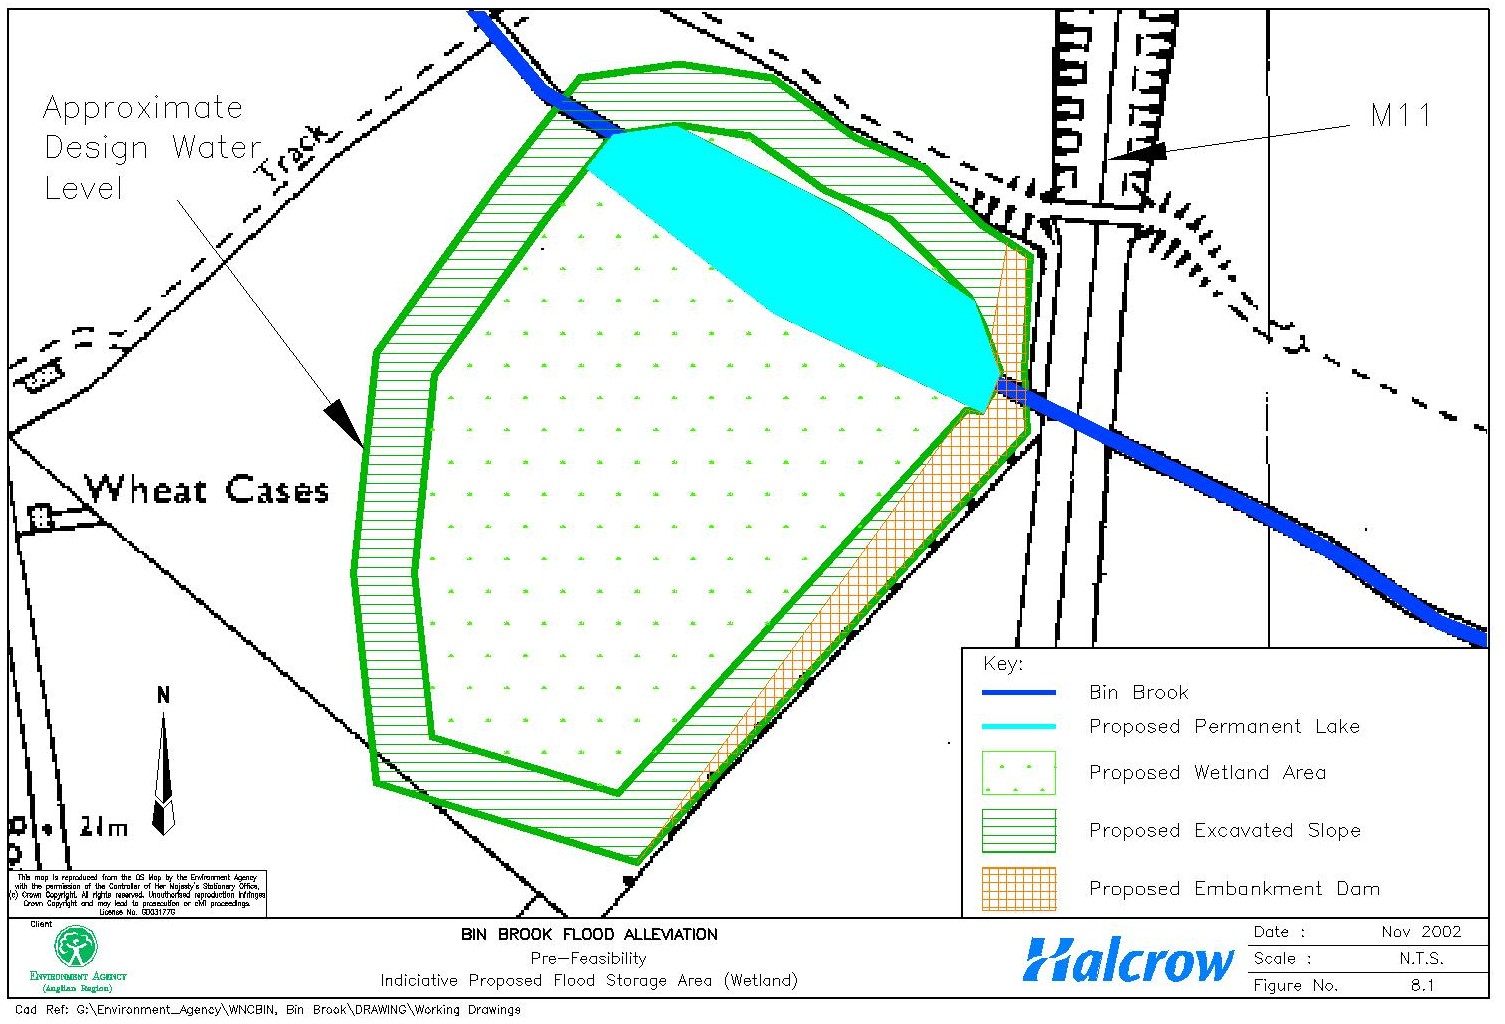
This option comprises the provision of an upstream storage area, adjacent to the M11 motorway. By considering the present capacity of the Gough Way culvert and relief channel system an approximate flood storage requirement in the order of 150,000 m3 has been calculated. The land is owned by the Cambridge Preservation Society (CPS) and has been offered for use in flood control on the basis that an ecological wetland would also be generated on the site.
LiDAR/Survey information has been utilised in order to investigate the existing ground profile for the proposed storage location. Ideally the area should maximise the potential storage volume by maintaining a balance between the cut and fill quantities required. However, due to the sloping nature of the ground surface and the aim of maximising the resultant wetland area, this balance cannot be struck.
A general indication of where the proposed flood storage area (FSA) is to be located is shown in Figure 8.1 contained in Appendix A. The configuration shown has been drawn to ensure it falls entirely within the land owned by Cambridgeshire Preservation Society.
The plan shows the likely maximum area achievable for a wetland in the base of the FSA. Unfortunately the amount of excavation needed to achieve this configuration exceeds by many times the volume of fill required to form the embankment dam. This results in an excessively high construction cost. This option is identified as option 4(c).
An alternative, more economic approach has been considered, in which a closer balance of excavation and fill would be achieved. This will produce the most economic solution but provide a much smaller area of wetland (see Fig. 8.2).
On this basis, costs have been generated for providing both 50 year (option 4(a)) and 100 year (option 4(c)) standards of protection to the properties downstream.
The above FSA location would require the construction of an embankment (of the order of 3 to 3.5m maximum height) across the valley and a control structure to restrict the flow. The design water levels generated in the FSA will not adversely affect the village of Coton or any other adjacent properties.
Consideration was given to the use of the M11 embankment as the flood storage containment, but was rejected on the following grounds:
Insufficient height (only approximately 1 m high)
The resulting FSA would be partly outside the CPS land ownership
The embankment’s design and construction will not have been appropriate to the standards required for retaining water.
Floods in excess of the design case would overtop the embankment and flood the motorway.
9 Economic Appraisal
9.1 Introduction
The economic appraisal has been carried out using spreadsheets and an application named Damage Calculator (Version 1.0.7 developed by Halcrow) following the DEFRA Flood and Coastal Defence Project Appraisal Guidance document for Economic Appraisal (FCDPAG3). Sections below document the damages that have been assessed and the evaluation of the benefit to cost ratio.
The DEFRA priority score for providing a ranking for grant aid has been calculated with reference to the approximate benefits/cost, and follows the new DEFRA (2003) Scheme Prioritisation notes published March 2002.
An appraisal has been carried out for the following options,
Option 1 – Do Nothing
Option 2 – Maintain existing
Option 3 - Enlargement of channel capacity
Option 4 – Flood Storage reservoir
Limited data has been used to determine the benefit/cost ratios and DEFRA priority scores and it has been necessary to make several approximations and assumptions. The results produced are intended to give guidance as to whether any of the options will be economically viable and therefore progressed to a further, more detailed stage of investigation. The following sections document the methodology, results generated, and recommendation for preferred solution at this stage, all of which should be reviewed in further detail should the study be taken further. Extracts of relevant calculations are included for reference in Appendix C.
9.2 Damages and Benefits
Each property at risk from flooding was identified and a threshold level assigned. Property threshold levels were determined by the Agency after the October 2001 flooding event, and additional levels were taken during a site visit to the study area. The peak water levels for the different event periods were determined from the modelling results, as reported in Section 6, and these were applied as appropriate to the affected properties to determine the damage likely to accrue.
For each option the Average Annual Damage and the Present Value Damage has been calculated using a combination of the Damage Calculator application and spreadsheets, extracts of which are included in Appendix B. This utilises model node point water levels applied to identified properties.
In the assessment the following assumptions/allowances are taken into account:
Nationally published flood depth - damage data (FLAIR 1990) for domestic properties are updated to current values by applying the Retail Price (All Items) Index. It should also be noted that a new FLAIR price database is due for imminent publication, and therefore subsequent studies are likely to use this newer damage cost information, together with any additional information obtained as part of further investigations.
The FLAIR residential property category is assumed to be social class AB and of modern property age (conservative and pending detailed evaluation). Note that residential damage commences at flood levels 300mm below property threshold.
Damage to vehicles, loss of electricity and its consequences due to sub-station inundation, or damage to other essential services have not been included and no further investigation of incidental damages has been carried out.
Temporary lodging costs have not been included, on the basis that the flooding depths and duration are not sufficiently severe to warrant removal of occupants to other accommodation during repairs.
Emergency response costs have not been included for similar reasons.
9.3 Costs
The capital costs of the options have been derived from published data, and are detailed in Appendix C.
Option 1 – Do Nothing
As this literally means to do nothing, but to walk away and incur no further costs, there is no cost associated with this option.
Option 2 – Maintain existing
This option continues with the present situation, maintaining the current level of works activity and associated costs. No capital costs are involved.
Option 3 – Channel enlargement
The estimated capital cost of option 3(a) is £470,000.
The estimated capital cost of 3(b) is £610,000.
Option 4 – Flood Storage
The estimated capital costs are estimated to be £484,000 and £585,000 respectively for the 50 year (option 4(a)) and 100 year (option 4(b)) design standards based on the flood defence requirements. The equivalent option (option 4(c)) to maximise the wetland area is £1.8million.
Ongoing costs – all options
The estimated ongoing maintenance costs adopted can be seen in the cost spreadsheets.
9.4 Economic Analysis
For the purpose of analysis the costs and benefits are compared using Present Values, obtained by discounting the capital and recurring costs and damages/benefits by the Government discount rate of 6% over a period of 50 years.
Current DEFRA advice is that for the purposes of sensitivity testing, the discount rate can be taken as 3.5% applied to doubled FLAIR values.
The Present Value option costs are summarised in Table 9.1. The derivation of these costs is further listed in Appendix C, together with a discount cost table.
All options (except the ‘Do Nothing’) include for annual maintenance and design fees together with further contingencies in recognition of the level of unknown quantities and risks.
Table 9.1 Summary of Present Value Costs
|
Options |
PV50 Cost (£) @ 6% |
PV50 Cost (£) @ 3.5% |
|
Option 1 – Do Nothing |
Nil |
Nil |
|
Option 2 – Maintain |
81,867 |
118,955 |
|
Option 3 – Increase channel capacity |
525,379 |
572,422 |
|
Option 4(a) – Flood Storage (FD requirements) |
580,130 |
647,373 |
|
Option 4(b) – Flood Storage (FD requirements) |
675,690 |
745,082 |
|
Option 4(c) – Flood Storage (wetland) |
1,822,393 |
1,917,582 |
9.5 Economic Viability of the Options
Within the DEFRA guidelines, the economic viability of a project is measured against the base-line case of ‘do nothing’. Under this scenario maximum damage/benefit values are generated, and options for alleviation are measured.
The do nothing damages have been assessed on the basis of a deterioration of the watercourse system, with the Gough Way culvert and the flood relief channel becoming blocked in 10 years. With this scenario it is assumed that 20 properties in close proximity to the watercourse will be flooded so frequently as to render them uninhabitable. In the analysis these are considered to be written off and their total market value (based on £500,000 each) together with ongoing annual flood damage to other properties, provides the damage value.
For each option a benefit/cost ratio is calculated, which to be viable should be equal to unity or greater. However, the guidelines also contain a requirement relating to the incremental benefit/cost ratio from one option to a higher standard option, which has to be met for the higher option to be considered.
Tables 9.2 and 9.3 below summarise the main Present Value Costs and Flood Damage costs for the various options at discount rates of 6% and 3.5% respectively. The build up of these costs is included in Appendix C. The resultant benefit/cost (B/C) ratios are also shown, together with the incremental B/C ratios.
Table 9.2 Benefit – Costs Table
|
|
Option |
|||||
|
|
1 |
2 |
3 |
4a |
4b |
4c |
|
PV Cost |
Nil |
81,867 |
525,379 |
580,130 |
675,690 |
1,822,393 |
|
PV Flood Damage |
5,648,696 |
138,660 |
38,092 |
17,300 |
13,434 |
13,434 |
|
PV Damage Avoided |
Nil |
5,510,036 |
5,610,604 |
5,631,395 |
5,635,262 |
5,635,262 |
|
NPV |
Nil |
5,428,169 |
5,085,225 |
5,051,265 |
4,959,572 |
3,812,869 |
|
Av B/C Ratio |
Nil |
67.3 |
10.7 |
9.7 |
8.3 |
3.1 |
|
Incremental B/C ratio |
- |
- |
0.2* |
0.2* |
0.04** |
0.1* |
* calculated against option 2
** calculated against option 4(a)
Table 9.3 Benefit – Costs Table
|
|
Option |
|||||
|
|
1 |
2 |
3 |
4a |
4b |
4c |
|
PV Cost |
Nil |
118,955 |
572,422 |
647,373 |
745,082 |
1,917,582 |
|
PV Flood Damage |
7,232,062 |
402,942 |
104,896 |
43,275 |
31,816 |
31,816 |
|
PV Damage Avoided |
Nil |
6,829,120 |
7,127,166 |
7,188,787 |
7,200,247 |
7,200,247 |
|
NPV |
Nil |
6,710,165 |
6,554,744 |
6,541,414 |
6,455,164 |
5,282,665 |
|
Av B/C Ratio |
Nil |
57.4 |
12.5 |
11.1 |
9.7 |
3.8 |
|
Incremental B/C ratio |
- |
- |
0.7* |
0.7* |
0.1** |
0.2* |
* calculated against option 2
** calculated against option 4(a)
Where:
Net Present Value (NPV) = PV Damages Avoided – PV Cost
Benefit-Cost Ratio (B/C Ratio) = PV Damage Avoided / PV Cost
9.6 Sensitivity
In addition to the application of a 3.5% discount rate and doubled FLAIR values, it can be seen that if the number of properties assumed to be written off is reduced from 20, a reduction in the B/C ratio will follow. Conversely, it is unlikely that more than 20 properties would be written off due to the topography of the ground through the Gough Way estate, and therefore an increase in B/C is not possible.
For the purpose of checking the effect on the incremental B/C ratio, option 2 (maintain existing) has been re-calculated assuming that the concrete relief channel will require replacement in year 40. At that time it will be approximately 60 years old and, theoretically, could be said to have reached the end of its design life. The capital cost of replacement has been taken to be identical to that for widening in option 3. Under this scenario the incremental B/C ratio to the next higher option of 50 year channel enlargement (option 3) increases from 0.2 to 0.3 at 6% discount and from 0.7 to 0.9 at 3.5%. Compared to the DEFRA test of a value of unity or greater, both continue to fail.
9.7 Priority Score
It is evident from the tables above that none of the alleviation options meet the DEFRA criterion of incremental benefit/cost ratios and therefore would not be eligible for grant aid. However, for purposes of illustration the option most nearly complying has been scored in accordance with the latest DEFRA priority scoring system. This is the channel improvements (option 3) which using the 3.5% discount case, results in a score of 26 points. The current indicative threshold score is 9 points.
10 Environmental Overview
10.1 Screening and Scoping
The proposed options for the alleviation of flooding from the Bin Brook are as follows:
Option 1 – Do Nothing;
Option 2 – Maintain/ Do Minimum;
Option 3a – Increase Capacity of Relief Channel;
Option 3b – Increase Capacity of Gough Way Culvert; and
Option 4 – Flood Storage Reservoir.
These options have been considered from an environmental perspective and, following a desk top study of the area and consultation with internal Agency consultees, a Screening and Scoping File Note was produced (Appendix E"). This File Note identifies the level of Environmental Impact Assessment that will be required for each option. It also identifies key impacts upon the environment that may influence the choice of option or may constrain implementation of the preferred option. Each option was considered in terms of the following:
Human Beings;
Flora and Fauna;
Air and Climate;
Landscape and Visual Amenity;
Water;
Land Use;
Cultural Heritage, Archaeology and Material Assets;
Traffic and Transport;
Soil, Geology and Hydrogeology; and
Use of Natural Resources.
10.2 Environmental Constraints and Opportunities
10.2.1 Introduction
A number of environmental constraints have been identified for the five options. These are explained briefly below, further details are available in the Screening and Scoping File Note.
10.2.2 Option 1 – Do Nothing
The following environmental impacts will arise from the implementation of the Do Nothing Option:
Significant disruption and disturbance to residents of the Gough Way estate due to increased flooding following deterioration of the channels and culvert;
Significant damage to properties from flooding, resulting in them eventually being uninhabitable;
Significant stress to residents due to properties becoming uninhabitable;
Potential adverse impacts upon any protected species in the flooded area;
Potential beneficial impacts upon flora and fauna due to reversion to natural channel and natural floodplain;
Potential adverse impacts upon fisheries as the channel becomes blocked;
Potential deterioration of the landscape as the area becomes damaged by flooding;
Potential beneficial impacts upon landscape as the Bin Brook reverts to a natural channel and floodplain;
Potential impacts upon the water quality of the Bin Brook due to deterioration of the channels and flooding of properties and drains within the Gough Way estate;
Potential deterioration of arable land due to increased flooding making it unsuitable for its current purpose;
Potential restrictions of traffic movements within the Gough Way estate due to increased flooding; and
Potential contamination of soils and groundwater from contaminants within the floodwaters.
10.2.3 Option 2 – Maintain/ Do Minimum
The main environmental impact of the Maintain option that has arisen during the environmental scoping is that residential properties will continue to be flooded during extreme events.
10.2.4 Option 3a – Increase Capacity of Relief Channel
The following adverse environmental impacts from the option to increase the capacity of the relief channel have been identified during the production of the Screening and Scoping File Note:
Potential disruption and disturbance to residents of the Gough Way estate due to works taking place at the bottom of residential gardens;
Potential disturbance to breeding birds if works take place within the bird-breeding season;
Potential impacts upon bats if trees forming bat roosts are removed;
Potential flood defence impacts during construction due to works taking place within the relief channel;
Potential damage or disturbance to archaeological finds and features during construction; and
Potential significant increase in traffic within the estate during construction.
The Increase Capacity of Relief Channel Option could result in improvements to the standard of flood protection provided to residents of the Gough Way estate and nearby properties, to a standard of 1 in 50 years.
10.2.5 Option 3b – Increase Capacity of Gough Way Culvert
The following adverse environmental impacts from Option 4b have been identified during the production of the Screening and Scoping File Note:
Disruption and disturbance to residents of the Gough Way estate due to increased noise levels and visual disturbance during construction;
Disruption to residents immediately adjacent to the works due to the need to remove garden fences and possibly work within residential properties;
Disruption and disturbance to residents of the Gough Way estate due to closure of the Gough Way road and possible loss of access to parts of the estate during construction;
Disruption and disturbance to residents of the Gough Way estate due to closure of the walkway through it during construction;
Potential adverse impacts upon fish due to de-watering of the channel;
Potential worsening of the flood defence standard during construction, due to closure of the main channel, therefore reducing the capacity from that of the existing situation;
Potential adverse impacts upon water quality due to in-channel working;
Adverse impacts upon traffic due to the closure of the Gough Way road during construction; and
Potential increase in traffic during construction.
Implementation of this option could result in an increase in the standard of flood protection to residents of the Gough Way estate and nearby properties to a standard of 1 in 50 years.
10.2.6 Option 4 – Flood Storage Reservoir
The main environmental impacts arising from environmental scoping of the Flood Storage option are as follows:
Potential impacts upon a public Right of Way during construction, this may therefore need to be temporarily diverted;
Potential adverse impacts upon a public Right of Way during flood storage, the Right of Way may therefore need permanent diversion;
Potential impacts upon protected species, which may be located within the study area, for example water voles (Arvicola terrestris). A walkover survey will need to be undertaken to assess whether any protected species are present;
Potential impacts upon breeding birds if works take place within the bird-breeding season (March-August);
Potential impacts upon bats if trees forming bat roosts are removed;
Potential impacts upon fish due to in-channel works and temporary diversion of the channel;
Potential significant impacts upon the landscape due to construction of the embankment, forming a large unnatural feature;
Potential impacts upon channel ecology due to culverting part of the channel;
Potential impacts upon water quality due to in-channel works;
Potential impacts upon archaeological finds and features during construction; and
Potential increase in the volume of traffic in the works area.
The Flood Storage Option could result in the following environmental improvements:
Increase in the standard of flood protection to residents of the Gough Way estate and nearby properties to a standard of 1 in 50 years; and
Potential ecological enhancement if the flood storage area was to be created as a wetland and managed appropriately. This could create important wet grassland habitat.
10.3 Environmental Conclusions
In conclusion, Option 1 "Do Nothing" is not a viable option due to the considerable damage, and disruption, which would be caused by the eventual flooding of the study area. This option is not considered to be environmentally acceptable due to the damage and disruption that would result.
Option 2 "Maintain existing" will not result in any adverse or beneficial environmental impacts, the situation will remain as at present. This option is considered to be environmentally acceptable, however will not provide an increase in the standard of flood protection.
Option 3a "Increase Capacity of Relief Channel " will result in fewer adverse environmental impacts than Option 2, which again can be minimised by mitigation. There are no ecological benefits to be gained from this scheme. At this stage this option is considered to be environmentally acceptable, however, more detailed assessment of the impacts upon the study area should be undertaken prior to selection of the option.
Option 3b "Increase Capacity of Gough Way Culvert" will result in considerable disruption and disturbance to residents of the Gough Way estate. The are no ecological benefits to be gained from this scheme. This option is not considered to be environmentally acceptable due to the considerable disruption and disturbance which would be experienced by residents of the Gough Way estate during construction, however, following more detailed assessment of the environmental impacts, this option may be preferable to the alternatives.
Option 4 "Flood Storage" will result in adverse environmental impacts from the construction and operational phases of the scheme, however, mitigation measures can be implemented to reduce these. The flood storage area, offers ecological benefits due to the creation of a wetland. At this stage in the option appraisal this option is considered to be environmentally acceptable, however, further investigation of the study area is required before the environmental impacts of the scheme can be fully appraised.
11 Conclusions and Recommendations
11.1 Conclusions
The following conclusions are drawn from the study:
The return period of the October 2001 flood lies between a 1 in 50 and a 1 in 100 year event.
The current standard of protection afforded ranges from approximately 1 in 10 years at Laundry Farm, Barton Road and Clare Hall to 1 in 40 years for Gough Way and Fulbrooke Road. The majority of properties affected by flooding currently have a Standard of Protection of approximately 1 in 40 years. This is to be compared with the indicative standards for dense urban areas of 1 in 50 to 1 in 200 years.
With the predicted climate change these standards of protection would fall in 50 years’ time to below 1 in 5 years and 1 in 20 years respectively.
Flood alleviation works are technically and environmentally possible and could comprise increasing the channel capacity in the Gough Way area or creation of flood storage upstream at the M11 motorway.
The incorporation of a wetland within the flood storage area is feasible, but to maximise this area would entail very significant cost relative to the available flood defence benefits. A flood storage area based primarily on flood defence requirements could also provide an area of wetland albeit of much reduced size. The creation of such a wetland could also provide a significant public benefit.
Option 3 (the enlargement of channel capacity to provide a 1 in 50 year standard of protection) at a present value cost of £572k (3.5% discount rate) is the nearest to meeting the economic criteria, and would provide a more economic solution than a flood storage area. At a 6% discount rate, option 3 has a benefit/cost ration of 10.7 and an incremental benefit/cost ration of 0.2. At a 3.5% discount rate, it has a benefit/cost ratio of 12.5 and incremental benefit/cost ratio of 0.7.
Under the current DEFRA guidelines none of the options considered are economically viable and eligible for grant aid. This position does not change by application of the sensitivity test of 3.5% discount and enhanced FLAIR values, nor by the sensitivity test of replacement of the concrete relief channel in the do nothing option.
Further work could be carried out on sensitivity testing of the option costs following receipt of the geotechnical information and further investigation of the 600mm water main traversing the site.
The additional option of constructing a diversion channel from Bin Brook at Barton Road leading to the existing flood bypass channel around Gough Way could also be considered.
11.2 Recommendation
As none of the options meet DEFRA’s economic criteria, there is no preferred solution that could be recommended for a detailed appraisal study for eventual submission to DEFRA for grant aid.
Further work could be carried out to maximise the benefit/cost ratio but it is unlikely that an option could be devised which would attract grant aid.