|
|
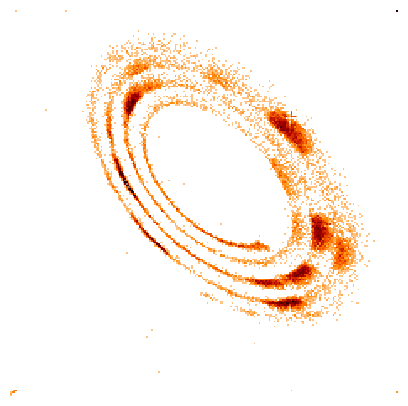
The GIS detectors are composed of a stack of micro-channel plates (MCPs), and a spiral anode (SPAN) to read the position and charge of the electron cloud created by the MCPs. The reading is converted with an 8-bit analogue to digital converter (ADC) which outputs data at (x, y) position values (known as GIS raw data). The (x, y) values form a spiral in cartesian coordinates (see Figure 2), which contains all the one-dimensional spectral information (the GIS being astigmatic, no more information is needed). The wavelength varies with distance along the spiral and the width of each arm is related to the noise in the electronics.
|
A set of parameters, called a look up table (LUT) is produced for each detector, fitting this spiral pattern, in order to convert the signal produced by the photon events to an array of 2048 spectral data points as a function of wavelength.
Because the gain in the micro channel plates is sensitive to the intensity, the voltages applied to each detector are adjusted depending on the slit used and the solar conditions (active or quiet sun), creating different spiral patterns, each requiring a different set of LUTs.
Because it takes too long to telemeter to the ground the raw data, this is done only once in a while to generate the LUTs. Normally the raw data are converted on-board by applying a set of LUTs, uniquely identified by a number GSET_ID, to the raw data. Various sets of LUTs are stored on-board for use, and loaded before the GIS starts exposing (it takes about half an hour). It is important, during planning, to select the correct set of LUTs (i.e. GSET_ID number) for the type of observation, otherwise the telemetered spectra are not usable.
CDS data analysis + spectroscopy using CHIANTI - MEDOC 2003 |
UNIVERSITY OF CAMBRIDGE Department of Applied Mathematics and Theoretical Physics |
|
8 of 41 |